


If I Ain't Got You.
Technicals vs. Fundamentals! Last week, there were significant positive technical developments, while over the weekend, Apollo's economist said a US recession is coming. Who is right? Let's dig in...

We are back to the age old question - who is right the economists or the markets?
Last week, there were three strong technical signals (not just the lines on the chart that I draw, but “under the surface” strength):
The first was an breadth or accumulation signal.
We showed the percentage of advancing shares as a percent of total over several days in chart 5 last Thursday (here).
Breadth is a reflection of the number or percentage of shares participating in a move = strong breadth and has historically been consistent with six month and one year positive returns.
We are showing a breadth thrust signal in chart 5 today.
The second is a momentum signal.
Last week was the 32nd time when four of six successive S&P 500 trading days were up at least 0.5% and three of those four days were up at least 1.5%.
Of the previous 31 times, 30 have had positive returns one year later with the exception occuring concurrent with September 11th.
On average, the one year S&P 500 return after this condition has occurred has been 22%.
The third is a volatility signal.
Last week, the volatility index (VIX) closed beneath 25, after a spike above 50.
Since 2008, this occurred five times prior to last week (short history and limited data set).
After this signal, the S&P 500 has been higher 6- and 12-months every time with average returns of 11% and 15%, respectively.
In other words, technical indicators that have historically been consistent with positive and above typical one-year S&P 500 performance are flashing green. (History doesn’t repeat and means nothing - just ask compliance and see disclaimers).
On the other hand, Torsten Slok, Apollo’s Chief Economist presented a case for a 90% chance of what he called a Voluntary Trade Reset Recession (“VTRR”) (here).
In his words, “Expect ships to sit offshore, orders to be canceled, and well-run generational retailers to file for bankruptcy.” (See Chart 2 below).
If we were to simply lay out the “bear” case for equities, it dovetails with Torsten Slok’s recessionary call:
Store shelves are empty;
Prices spike (inflation);
Bankruptcies rise;
Unemployment picks up;
Earnings drop (we showed what could happen to earnings in a recession - Chart 2 here).
On the other hand the “bull” case for equities is:
Trade deals begin to materialize;
Tariffs lead to some revenues for the US;
Some marginal manufacturing moves to the US;
The Trump administration is able to pass tax cuts;
The Fed cuts rates;
While data-center capex doesn’t grow like it has been, it is supportive of a vibrant economy;
The recession - if it occurs - is only two or three quarters with minimal long-term earnings impact;
Investors look through the recession - similar to the post covid period - and focus on earnings strength in 2026 and beyond.
Essentially, the bear case is that the tariff induced slow down will be long and with wide ranging implications and will be a difficult hole from which to climb.
While the bullish case suggests that while there will be a slowdown, it will be shallow and a White House “Put” (tax cuts, monetary easing, Treasury stealth stimulus) will lead to a recovery +.
The bullish technical dynamics reflect the equity market pricing in the bull market scenario.
Finally - and this is important and has been our concern for the last 10 months - in our view, the bull case is dependent on the behavior of 10-Year yields and essentially the market ignoring the US debt / fiscal situation. (See Chart 4).
That said, it is likely that at least 80% of the potential near-term upside has been priced in as the S&P 500 is currently trading at 20x next 12 months earnings and 18x 2026 earnings, both of which are coming down (see Chart 3).
As this is a big earnings week (35% of the S&P 500 reporting), the outlooks from CEOs and earnings revisions will provide some clarity on the impact of tariffs and potentially some encouragement to the administration to finalize some deals.
It is important to remember, we wrote a couple of weeks ago, chaos is a feature of Trump policy, not a bug.
While finalizing some trade deals will be critical, one deal is likely more important than the rest.
“If I Ain’t Got You.”

1. The S&P 500 ETF: Approaching its 50-Day Moving Average
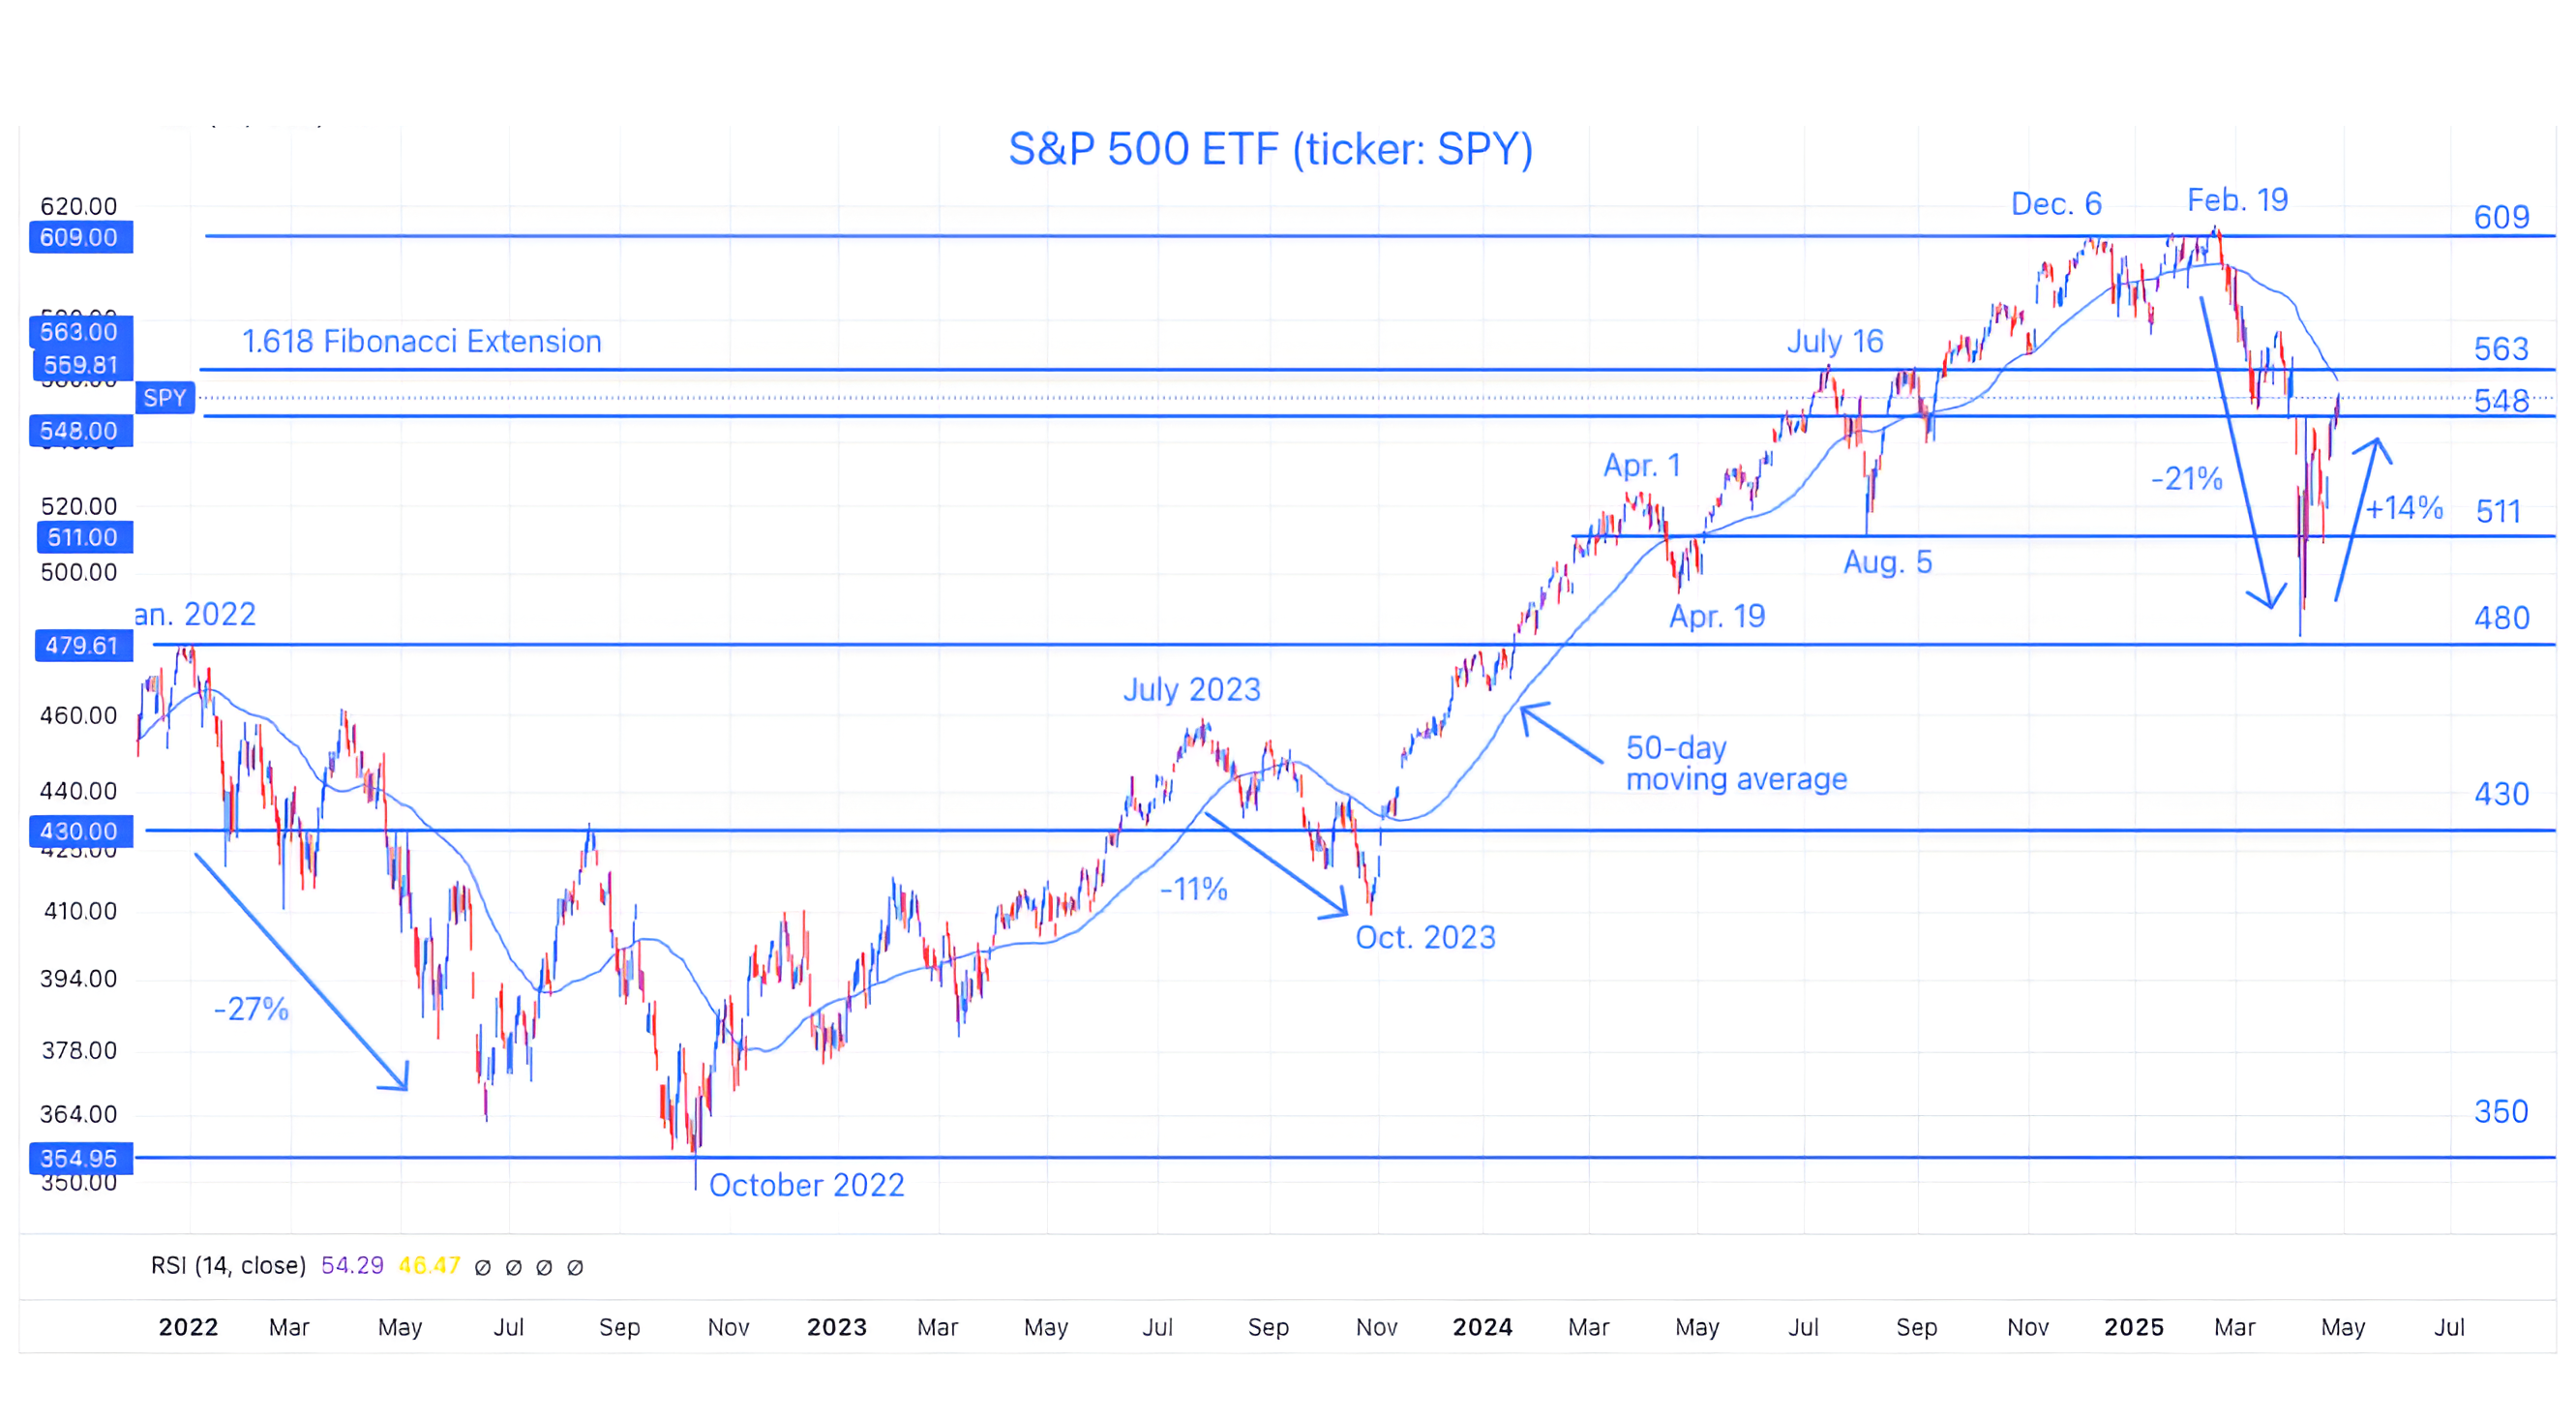
Source: TradingView. Through year-to-date 2025.
The chart above shows the S&P 500 ETF (ticker: SPY) with its 50-day moving average (curved blue line).
The 14% three-week bounce in the S&P 500 has been an impressive recovery.
While the S&P 500 has now surpassed its “Liberation Day” sell-off level of 548, it is now approaching its 50-day moving average and the 1.618 Fibonacci extension level of the 2022 sell-off.
We view both of these at battle-ground areas that may be difficult for the ETF (and the Index) to meaningfully surpass.
Although these are technical levels that we have highlighted in the past and could present a challenge, our constrained upside view is more a reflection of our fundamental bias than our technical perspective.
The S&P 500 is currently trading at 21x next 12 months earnings.
In our view, given the environment, a premium valuation (the long-term average is 16.5x and the last ten year average is 18.3x) is difficult to justify.
Furthermore, next 12 months earnings expectations are likely to come down (see chart 3) which means that even if the index level remains stable, the PE will increase.
As a result, we see valuation as a constraint on further significant near-term upside from current levels.
(This is not a recommendation to buy or sell any security and is not investment advice. Past performance is not indicative of future results. Please do your own research and due diligence).
2. Apollo’s “VTRR” Recession Timeline
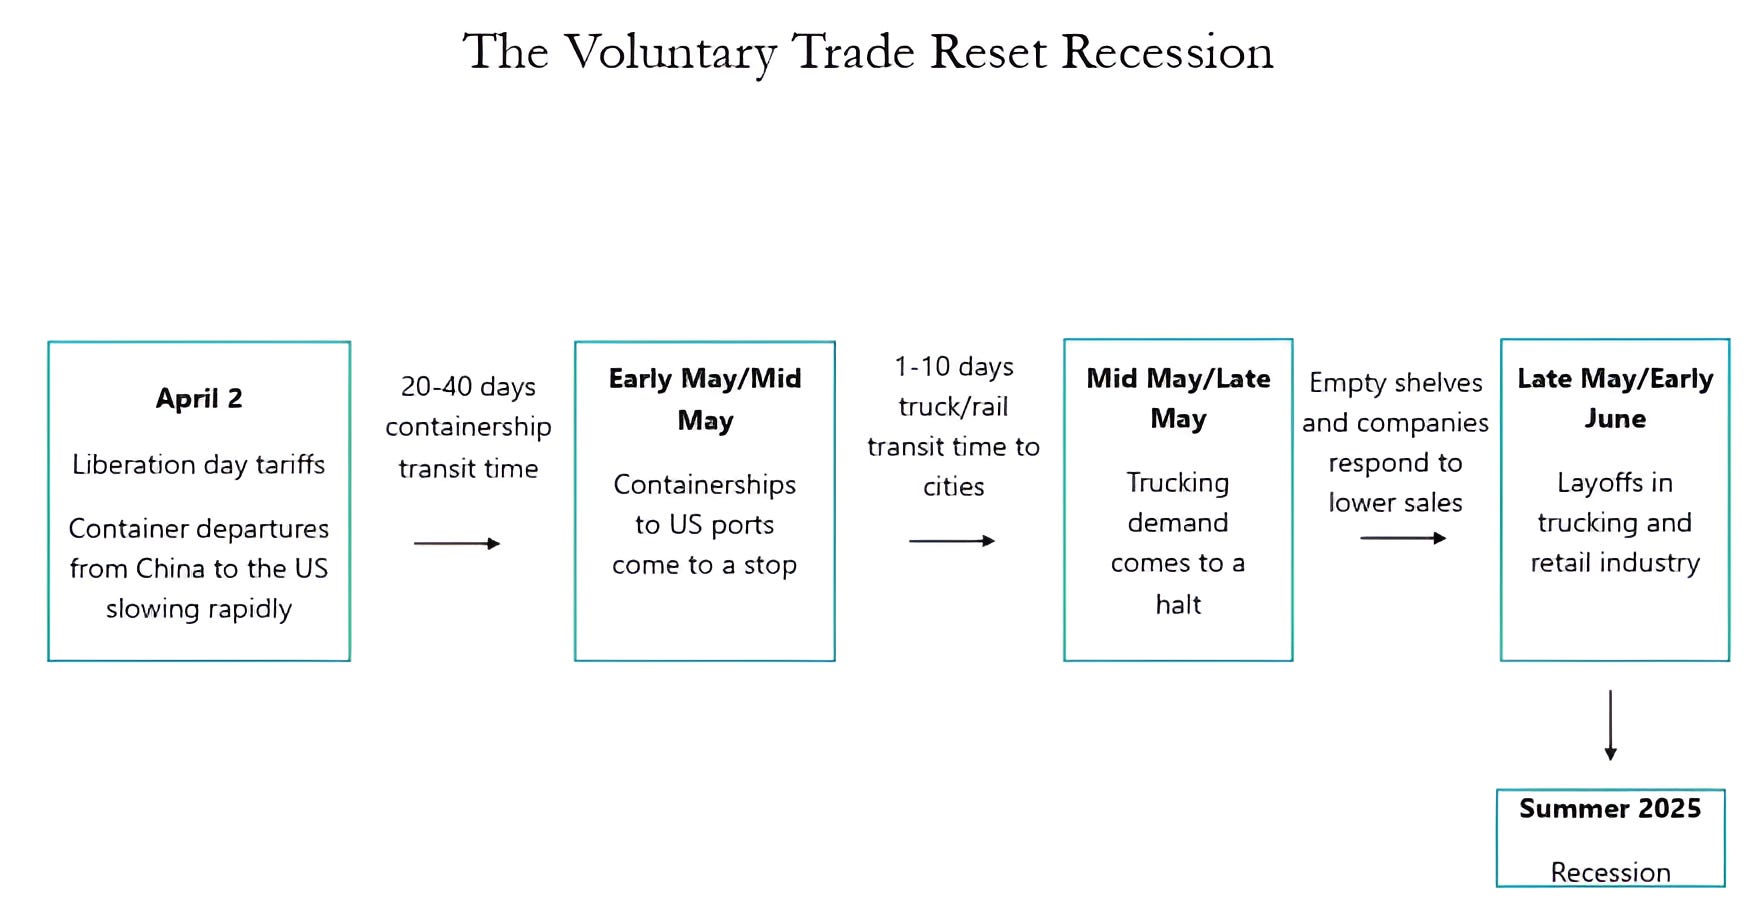
Source: Apollo Chief Economist. Through year-to-date 2025.
The chart above shows the Chief Economist from Apollo, Torsten Slok’s Sequence of Events and Timeline for the US Voluntary Trade Reset Recession (VTRR).
If this scenario is correct, the key will be the duration and depth (how many companies close / workers laid off) of the recession.
A recession that is quickly “cured” through policy without the long-lasting impact of business bankruptcies and heightened unemployment may not have significant further negative impact on equities.
(Past performance is not indicative of future results. This is not a recommendation to buy or sell any security and is not investment advice. Please do your own due diligence).
3. 2025 S&P 500 Earnings Trending Down, but Not Necessarily Reflecting a Recession
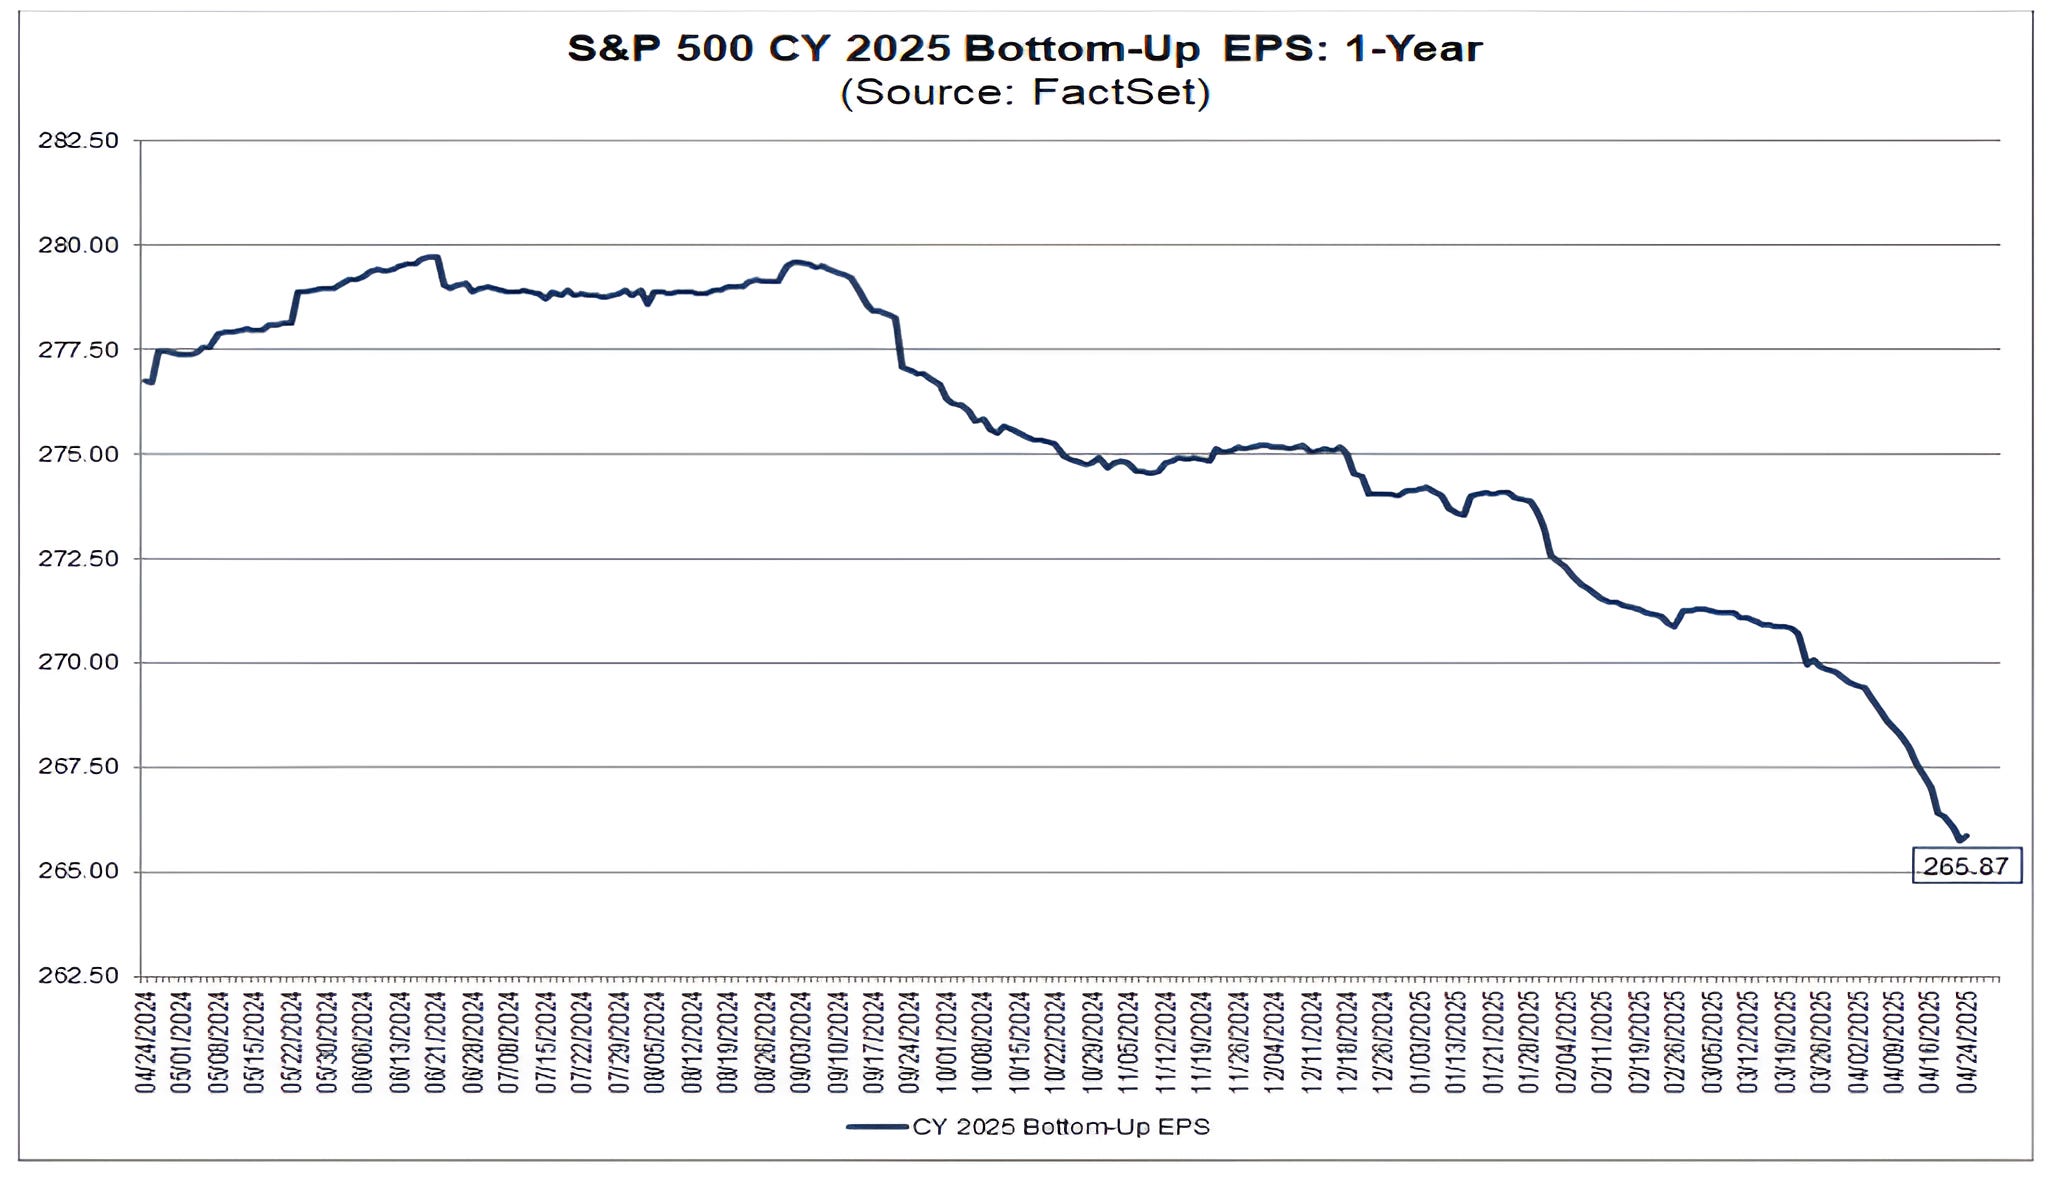
Source: FactSet. Through year-to-date 2025.
The chart above shows the Evolution of 2025 S&P 500 Bottoms-Up Earnings Expectations.
As a reminder, Bottoms-Up Earnings Expectations are calculated by taking the average analyst earnings per share projections for each company in the S&P 500 (Apple, Microsoft, JP Morgan, Exxon, etc.) weighting each of those estimates by the individual company weight in the index and aggregating them.
In August 2024, before the release of Q3 and Q4 2024 earnings (which both solid - Q4 surprisingly so), S&P 500 earnings expectations for 2025 were nearly $280.
Since that time, they have declined to $266.
As this is only a 4% decline, it might beg the question, if the Trump tariffs and policy are so bad and have upended 50 years of trade agreements and norms, is this too little?
In other words, either:
The tariff policy is not having the negative impact that is described in chart 2 by Torsten Slok (the Apollo economist); or
Companies and analysts have not yet seen the impact of the policies and a significant earnings correction is coming.
Over a third of the S&P 500 (40% based on market cap) companies are reporting earnings this week.
It will be informative to see if 2025 and / or 2026 earnings expectations move meaningfully as a result.
(Past performance is not indicative of future results. This is not a recommendation to buy or sell any security and is not investment advice. Please do your own research and due diligence).
4. 10-Year Treasury Yield Remains Contained (For Now)
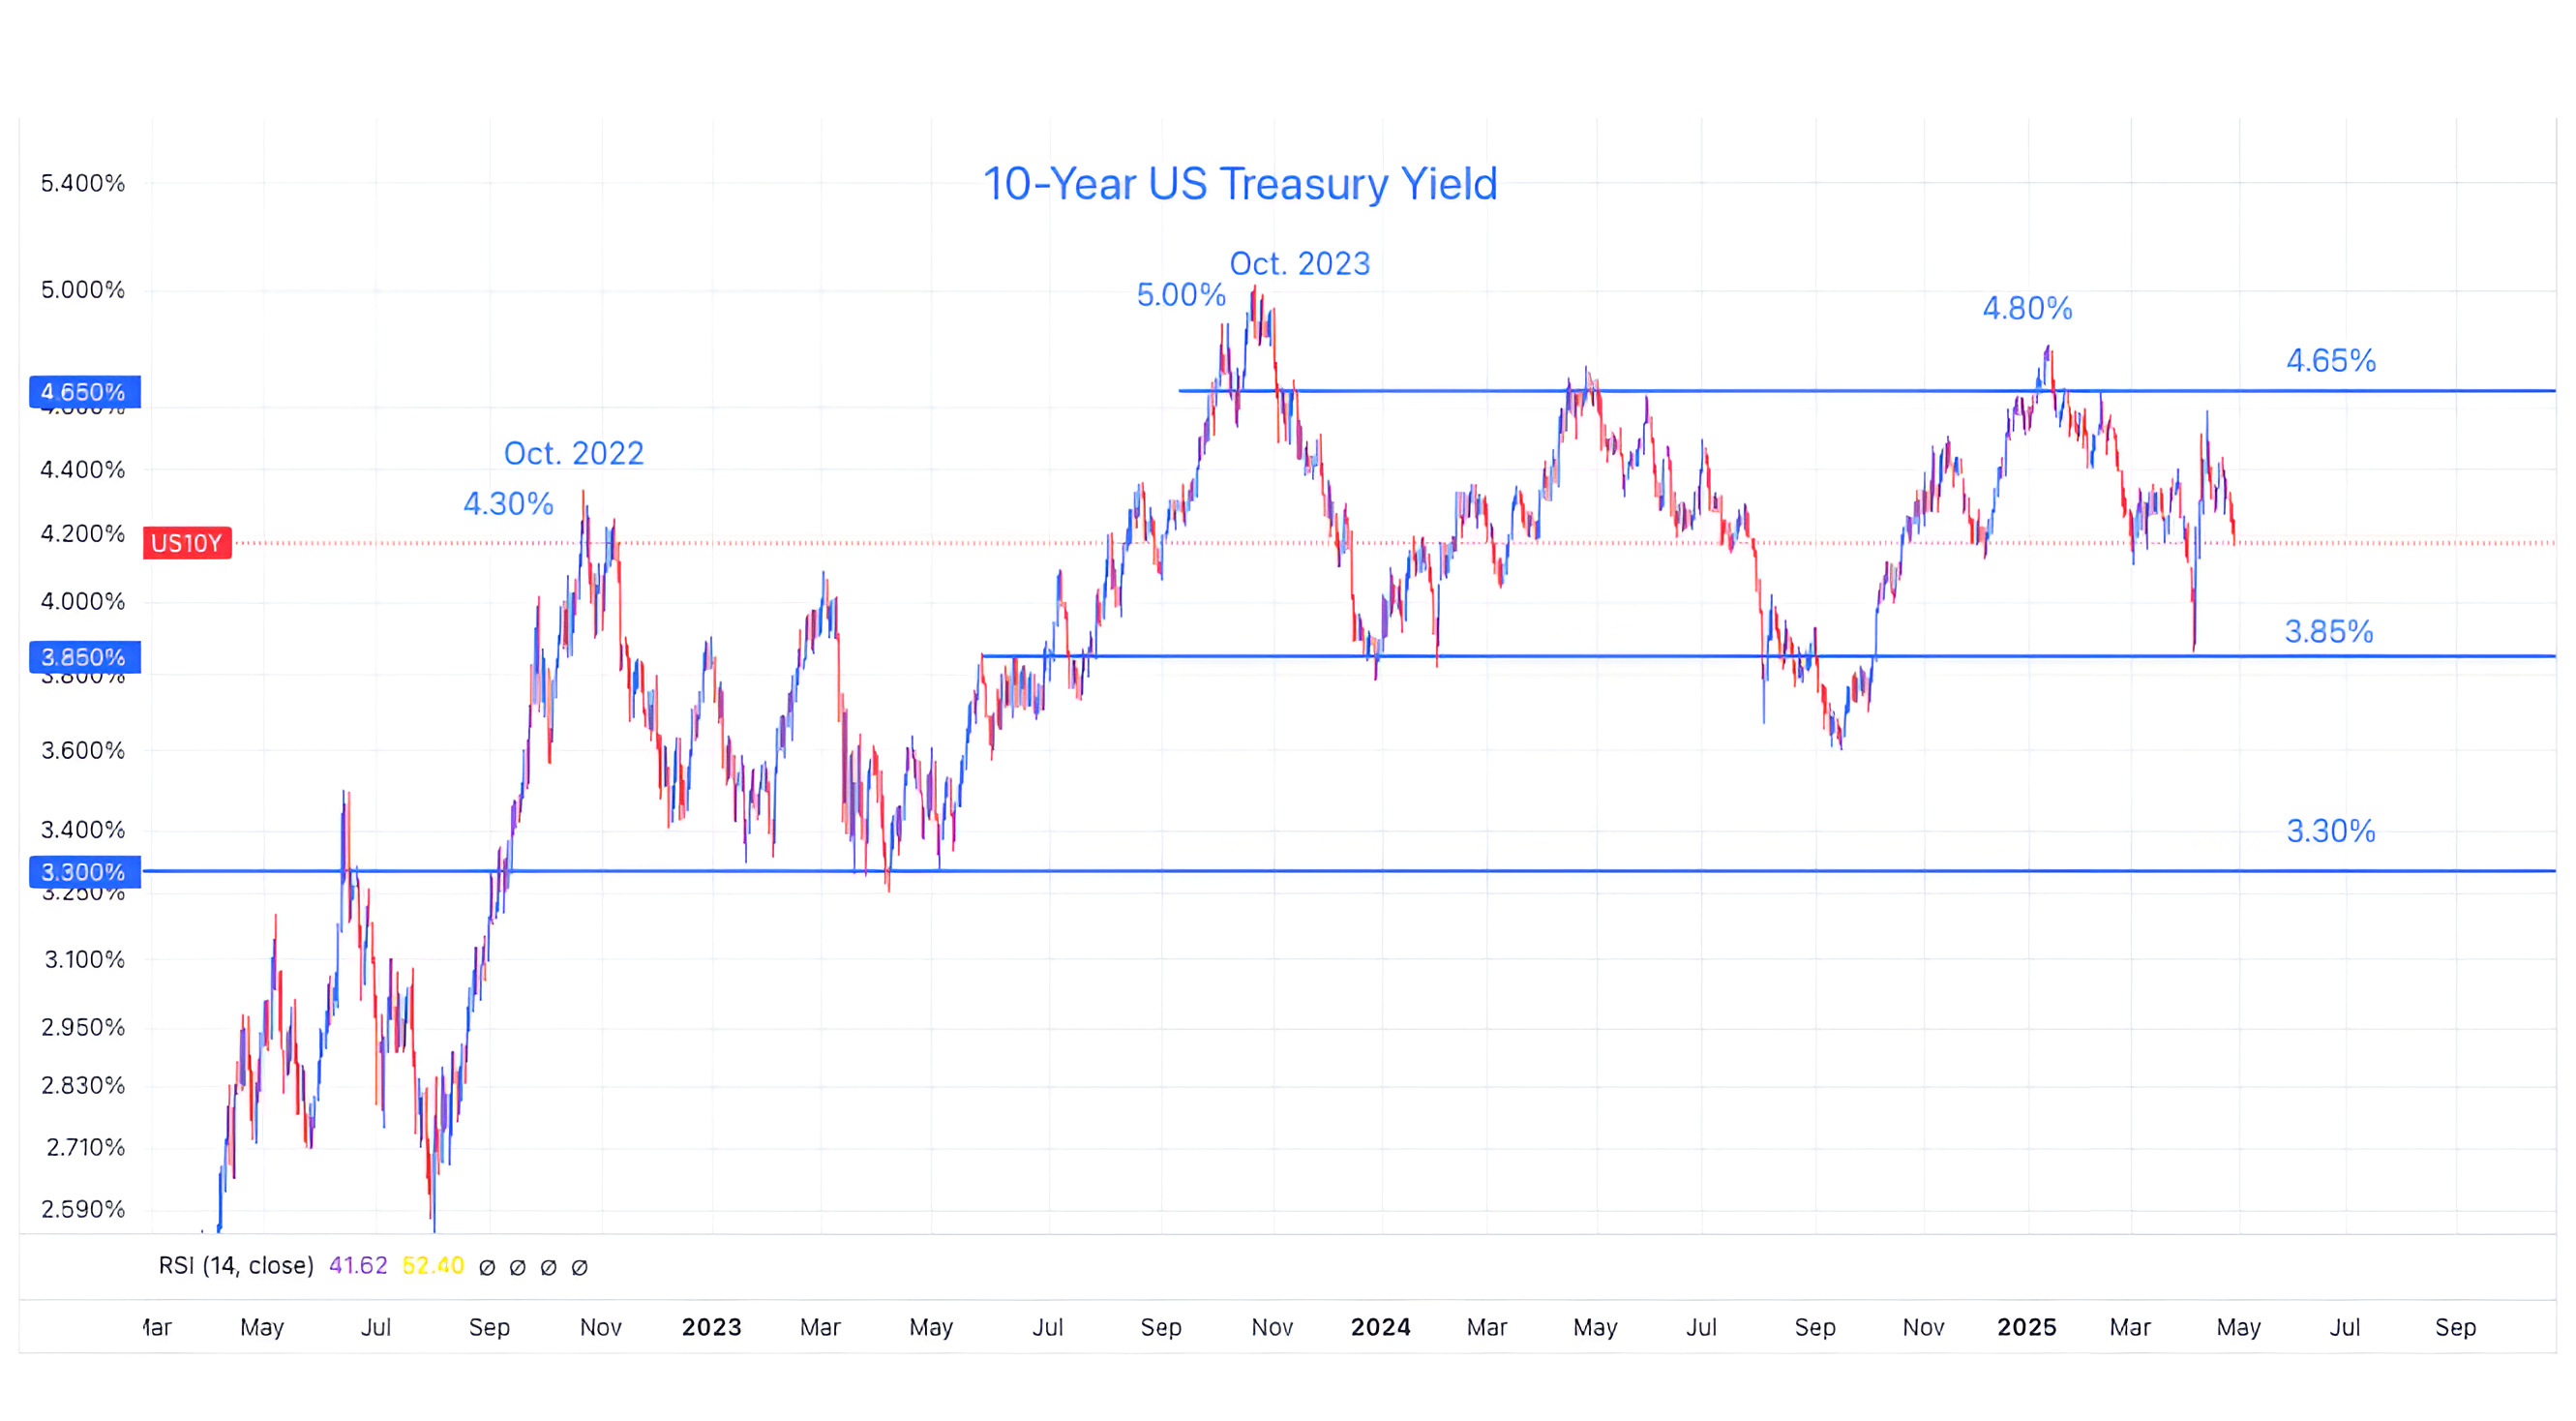
Source: TradingView. Through year-to-date 2025.
The chart above shows the 10-Year US Treasury Yield.
Entering 2025, my concern was that the bond market would consider:
the amount of issuance required to refinance maturing debt (Chart 1 here);
the fiscal deficit (chart 4 here); and
the $37 trillion in US debt outstanding;
and require much higher yields (5%+).
In my view, the Trump administration also recognized this risk and has embarked on a plan of cost cutting (DOGE) and revenues increases (tariffs) to mitigate it.
Given that the $9 trillion in debt that needs to be refinanced this year has an average interest rate of 3.6% (according to Strategas) and interest expense is already a larger US budget expense than defense spending (chart 3 here), I thought Treasury bond yields would be met this year with some form of Government Intervention (QE-like).
Neither the bond market sell-off (higher yields) or Government intervention has occurred yet - which in our view is a reflection (for the time being) of investors accepting the US fiscal and debt situation.
At some point this “bill will come due.”
This remains the biggest risk to market participants in our view and we are watching closely.
(Past performance is not indicative of further results. This is not a recommendation to buy or sell any security and is not investment advice. Please do your own due diligence).
5. A Zweig Breadth Thrust!

Source: Carson Investment Research / Ryan Detrick. Through year-to-date 2025.
The chart above shows Zweig Breadth Thrusts since 1943.
The Zweig Breadth Thrust - a market condition identified by the well known technician Marty Zweig - requires the 10 day moving average of NYSE advancing volume to go below 0.40 and then rise above 0.615 within 10 trading days.
Essentially, this condition reflects a rapid shift from a large number of declining stocks to a large number of advancing stocks.
This has occurred 19 times prior to the current period.
As can be seen from the chart above, subsequent to a Zweig Breadth Thrust, the S&P 500 has consistently had positive six and twelve month performance which, on average has been greater than typical.
(Past performance is not indicative of future results. This is not a recommendation to buy or sell any security and is not investment advice. Please do your own research and due diligence).