


Signs, Signs, Everywhere a Sign
From AI overspend, to inflated earnings expectations, to premium valuations in a concentrated market - everywhere there are signs that there may be volatility ahead. Let's dig in...
1. Will Investors Question AI Spending?

Source: TradingView. Through year-to-date 2024.
Over the past week, Goldman Sachs and Sequoia (a leading venture capitalist) questioned the return on investment in Artificial Intelligence. (Full reports here and here).
Essentially both asked whether the massive amounts being spent on what we have called the AI arms race will lead to a killer app that will either accelerate revenues higher or cut substantial costs.
Both concluded, in their own way, that either of these scenarios was, at best, a long way off.
A key portion of the Goldman report was a comment from Jim Covello, Head of Global Equity Research at Goldman Sachs:
People generally substantially overestimate what the technology is capable of today.
In our experience, even basic summarization tasks often yield illegible and nonsensical results.
This is not a matter of just some tweaks being required here and there; despite its expensive price tag, the technology is nowhere near where it needs to be in order to be useful for even such basic tasks.
Last Monday (here), we wrote:
Although the hyper-scalers have strong balance sheets, impressive cash flows and ability to fund capex, at some point, investors will likely consider whether the payoff is worth the investment.
This is what happened in the dot-com cycle and when Facebook began to spend excessively on the metaverse. In the dot-com era capital dried up and with Facebook and the Metaverse investors ran out of patience.
So our question, if Goldman Sachs and Sequoia are correct that the major benefit from AI is well into the future, is will investors begin to question the spending and, if so, when?
Rather than guessing at the answer to this question, we will watch the relationship between the Nasdaq 100 and the S&P 500 (chart above).
In our view, this relationship currently looks healthy (although maybe ready for a pause) - which is an indication to us that investors are still enthusiastic about the potential of AI.
If this relationship were to meaningfully reverse, we might take it as an indication that investors have run out of patience with AI spending.
(This is not a recommendation to buy or sell any security and is not investment advice. Please do your own research and due diligence).
2. This One Looks More Ominous than It Is

Source: Bespoke Investment Group. Through year-to-date 2024.
The chart above shows the rolling 6-month outperformance of the S&P 500 over the Equal Weight S&P 500.
The current 6-month 13.4% outperformance is the highest since March 2000.
For those with long memories (or who have studied US equity market history), you may remember that March 2000 was an ominous time.
That said, S&P 500 outperformance over the Equal Weight S&P 500 is not a catalyst, but in our view reflects what we consider to be a fragile market environment.
(This is not a recommendation to buy or sell any security and is not investment advice. Please do your own due diligence).
3. Q2 US Growth Estimates are Moving Lower
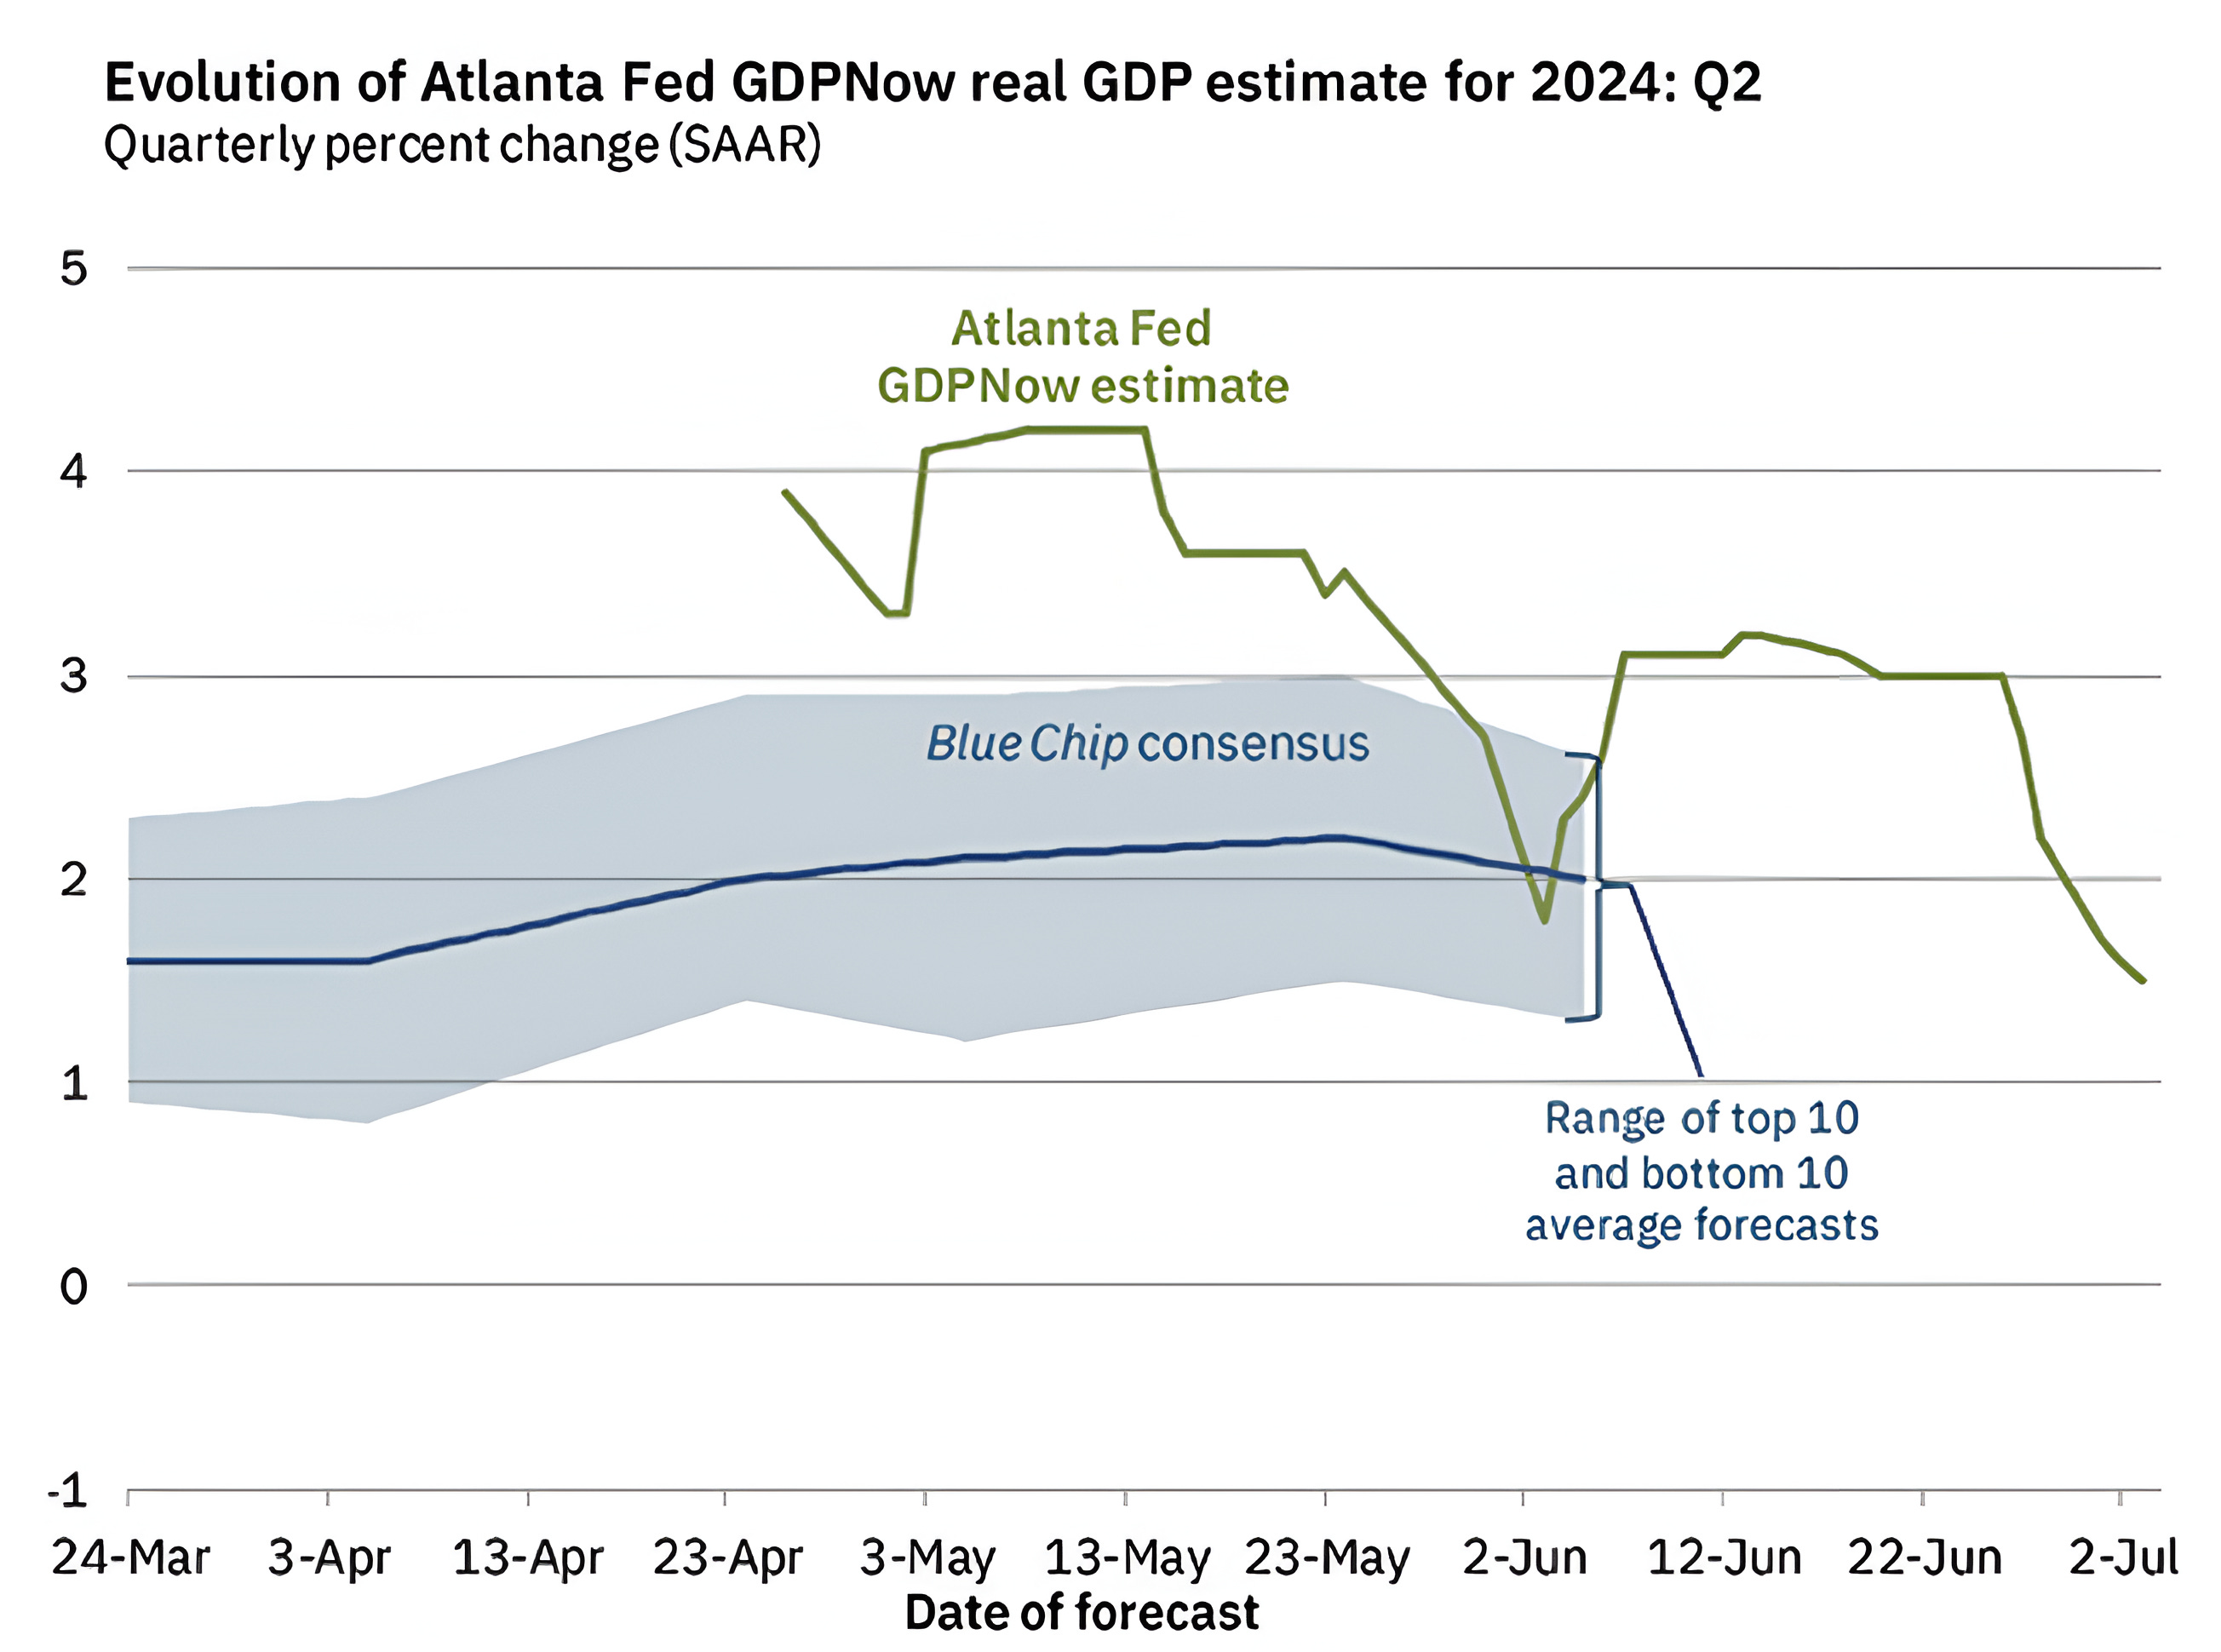
Source: Atlanta Fed. Through year-to-date 2024.
The chart above shows the Atlanta Fed GDP Now Q2 US GDP estimate and a range of estimates from the average of “Blue Chip” economists.
While the “Blue Chip” economist estimate is about 2%, the GDP Now estimate is 1.7%.
The GDP Now estimate incorporates economic data into the model as its released is down from 4.2% in mid-May and 2.2% in late June.
This is not to say that either the GDP Now or the Blue Chip economists are “right,” but rather to show that growth is moderate and doesn’t seem to be accelerating.
As a reminder, US GDP growth in Q1 was 1.4%.
Last week, we showed S&P 500 earnings growth by nominal US GDP tranche (chart 3 here).
We continue to question where the nominal US growth and S&P 500 earnings growth will come from (see chart 4 below).
(Past performance is not indicative of future results. This is not a recommendation to buy or sell any security and is not investment advice. Please do your own due diligence).
4. “Cut and Roll” Q2 Edition

Source: FactSet. Through year-to-date 2024.
The chart above shows analyst expectations for S&P 500 quarterly earnings as of April 26 and July 8.
It is easy to see that since April 26 analysts have trimmed earnings expectations for Q2, Q3 and Q4 2024 while increasing estimates for Q1 and Q2 2025.
During Q1, we called this phenomena “cut and roll.”
Analysts cut near term estimates and rolled the “missed” earnings into quarters far into the future.
By cutting near-term estimates and increasing longer-term outlooks, analysts are able to preserve aggregate next-twelve-months earnings projections.
It is clear that management teams have a better feel for Q2 2024 (which they are reducing) than they do about Q2 2025 (which they are increasing).
We have expressed our concern that earnings estimates have been aggressive and bordering on unachievable.
Management teams and analysts can continue to play this game, but in our view, at some point, the “music will stop” as investors will question companies’ ability to achieve future earnings expectations.
Q2 earnings season begins on Friday and we will be focused on earnings outlooks and revisions.
(Past performance is not indicative of future results. This is not a recommendation to buy or sell any security, please do your own research).
5. US Bankruptcies
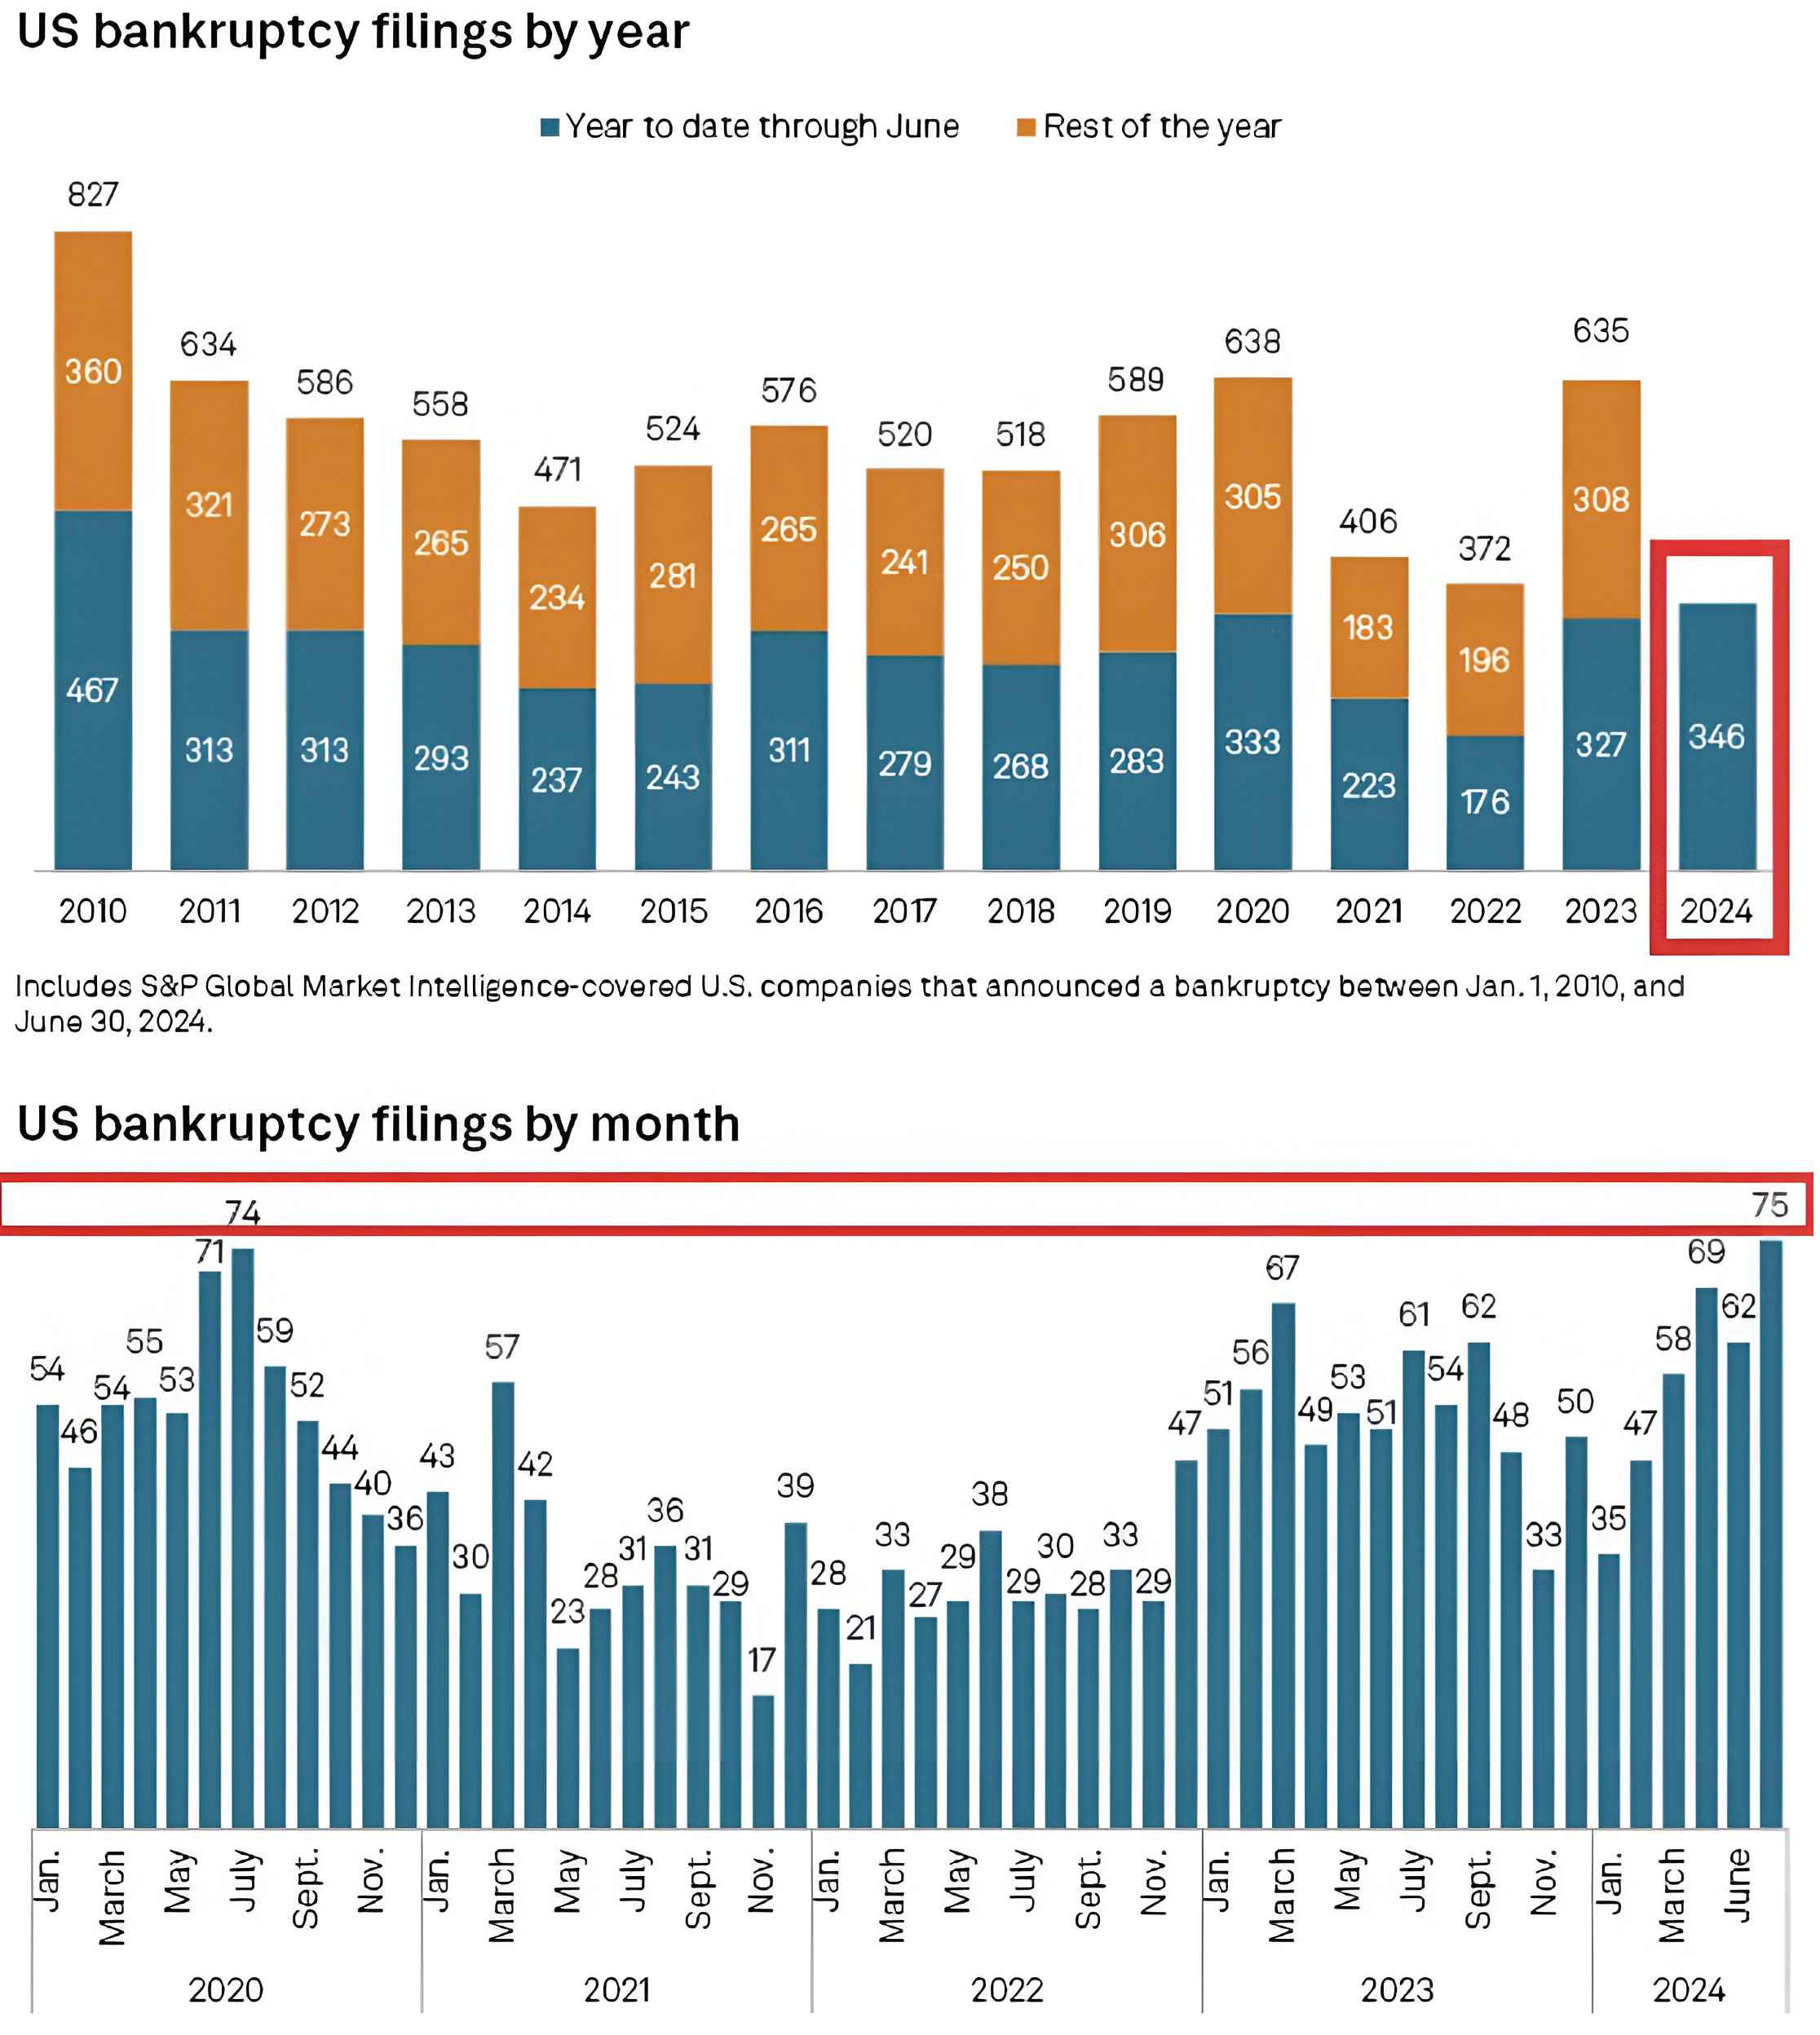
Source: S&P Global. Through year-to-date 2024.
The top panel of the chart above shows US bankruptcy filings per year including comparable data through June (lower portion of the bar). The bottom panel shows US bankruptcies per month.
There is some challenging news in the data: the first half of 2024 has seen the most US bankruptcies through June since 2010 and June has had more bankruptcies than any month of the past four and half years including during covid / post covid.
We can try to view this as a glass half full in that by 2010, the US recovery from the financial crisis had already begun and maybe the bad news (the first half of 2024) is in the past.
Re-reading this note in its entirety feels more pessimistic than our current equity positioning. That said, I continue to think that if a drawdown comes, we will all point to signs that seem to be everywhere except in the Index prices and performance.
As we have written in the past, while the music is playing (and the market continues to move higher), we need to continue to dance (stay invested).
(Past performance is not indicative of future results. This is not a investment advice and is not recommendation to buy or sell any security).