The Opposite of "Beat and Raise"
During earnings season, the mantra is "beat and raise." While the current focus has been on the Fed, new highs and a soft landing, earnings season (in aggregate) has been disappointing. Let's dig in.
1. Does Anyone Remember Fundamentals?
When we think about individual company performance during earnings season, the shares that “pop” higher when results are announced often “beat” expectations for the reported quarter and “raise” forecasts for the future.
In general, this “beat and raise” format provides investors confidence in a strong operating environment, justifies valuation and creates excitement in the market.
While we often think about “beat and raise” for individual companies, we can look at the S&P 500 overall and begin to characterize earnings season and the broad operating environment.
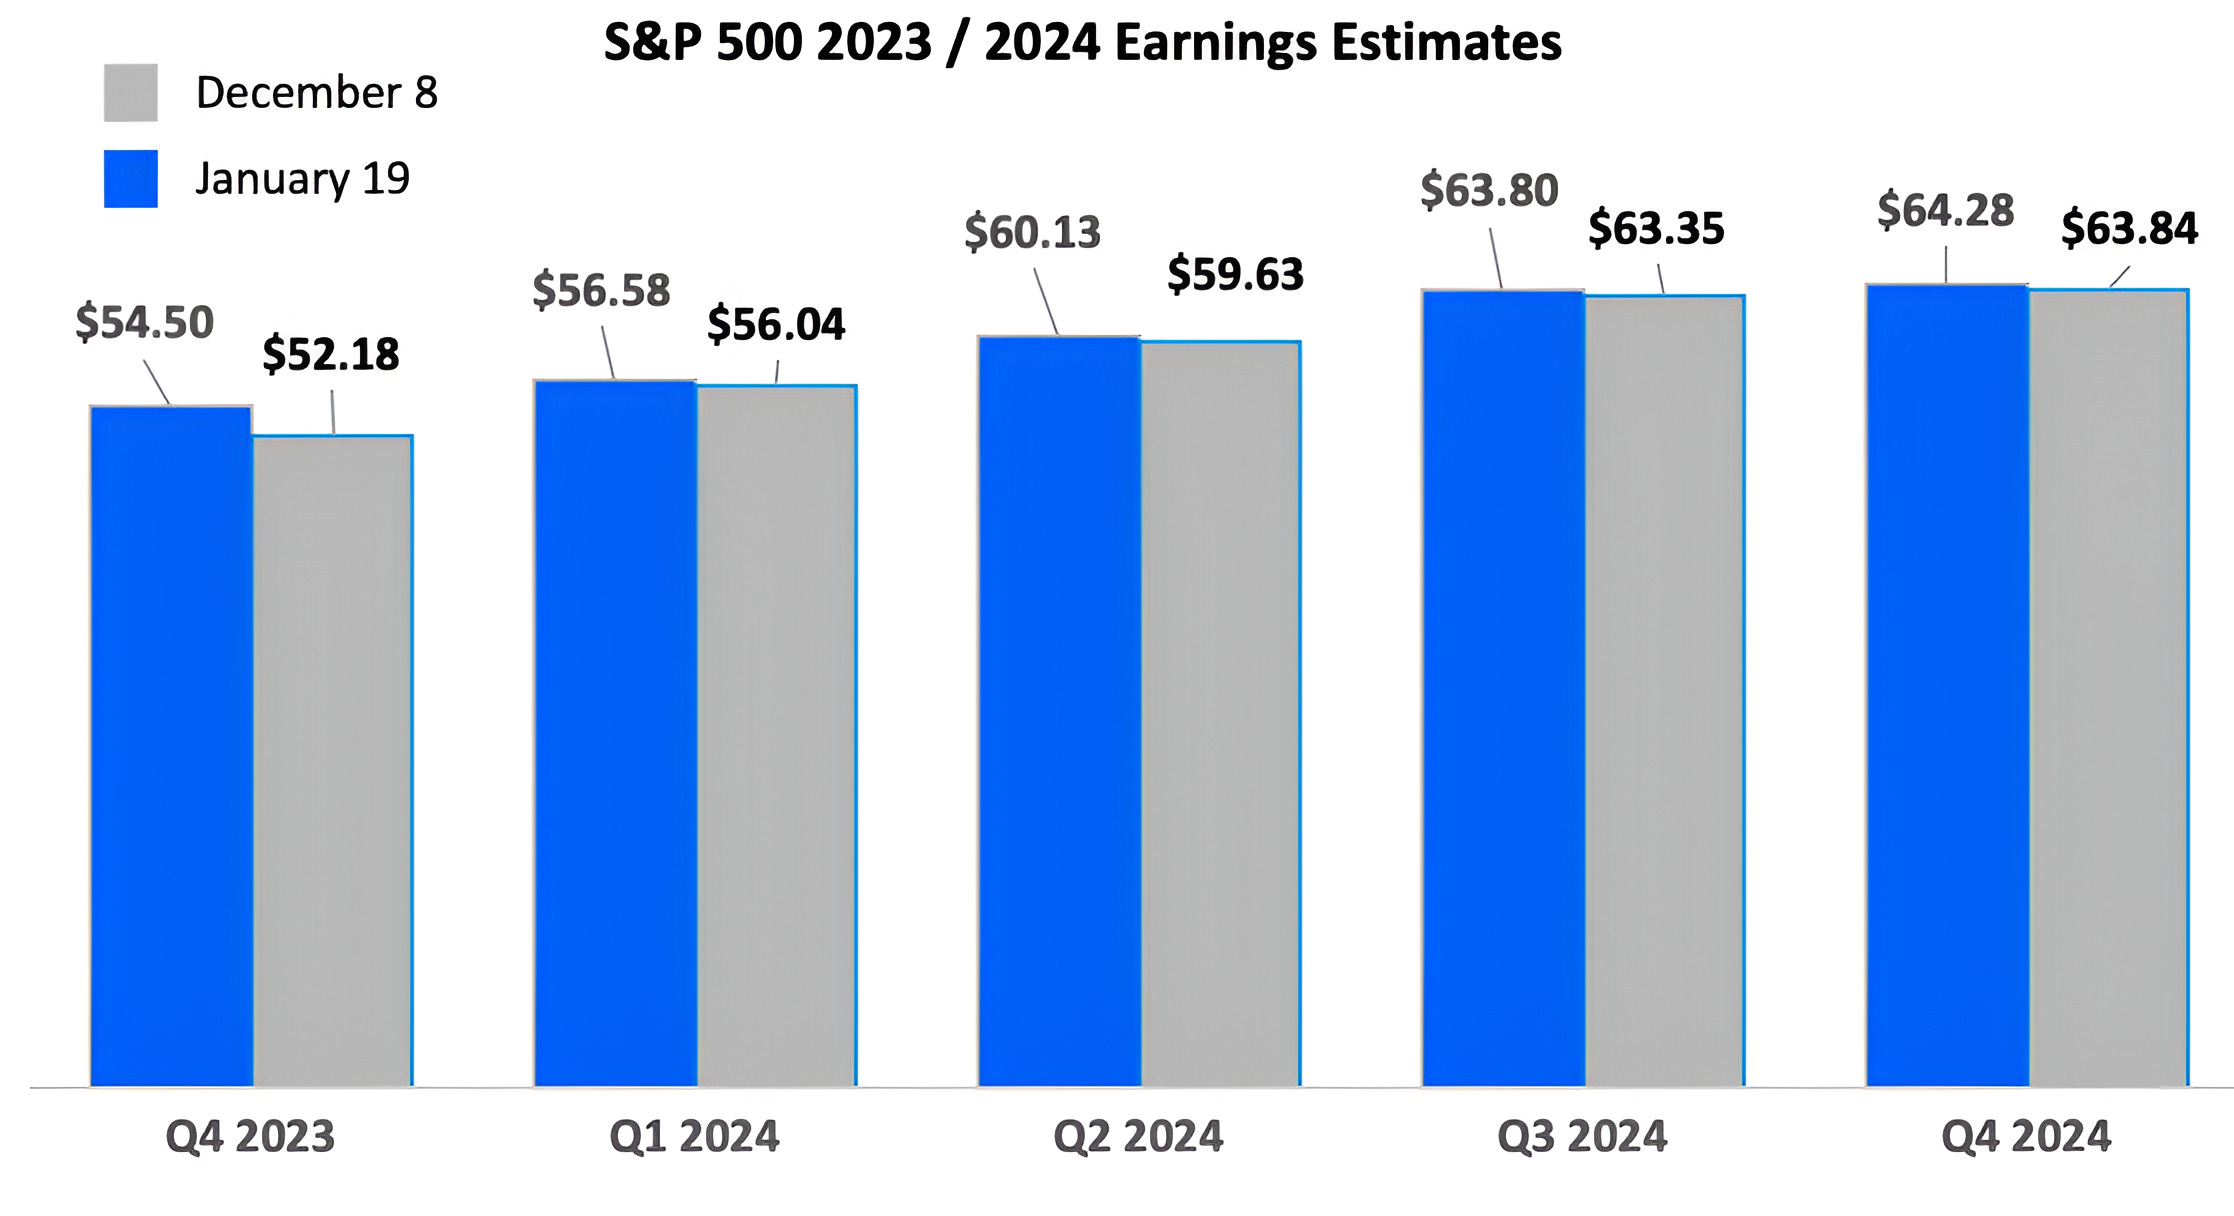
With that in mind, when we look at Q4 earnings they have been disappointing.
Although only 10% of S&P 500 companies have reported, they have missed expectations in aggregate by 4.3%.
Furthermore, if Q4 earnings were to end at $52.18 - the current blended estimate accounting for those companies that have reported and those that have not - it would represent a 2.4% year over year decrease in earnings.
On a full year basis, this would also mean that during 2023, a year in which the S&P 500 rallied 24%, earnings actually dropped by 0.4%.
This means two things: 1) all of the return in the S&P 500 during 2023 was attributable to multiple expansion; 2) expectations for future growth are robust.
(It is said that markets discount future scenarios - with that in mind, the weak market of 2022 “discounted” poor 2023 earnings, while the strong market in 2023 was “discounting” a strong 2024 earnings recovery).
In addition, to missing Q4 earnings, companies have been guiding analysts to lower 2024 forecasts.
Over the past five weeks, from December 8 to January 19, 2024 earnings estimates have been reduced by 1% from nearly $245 to less than $243.
As a result, thus far, we would characterize the current earnings period as “miss and lower” rather than “beat and raise.”
While this might not be a downside catalyst, if disappointing earnings continue, it may constrain further significant near-term upside.
(We have raised cash to moderate levels in our equity portfolios and implemented put spreads - this is not advice and may not be appropriate for all investors).
Source: FactSet. Through January 19, 2024.
2. What’s the Biggest Factor Driving Earnings Lower? Margins
Coming out of the pandemic, with strong demand for almost anything, companies talked about supply chain issues and labor shortages to justify raising prices.
Management teams looked like heroes for navigating such a difficult environment.
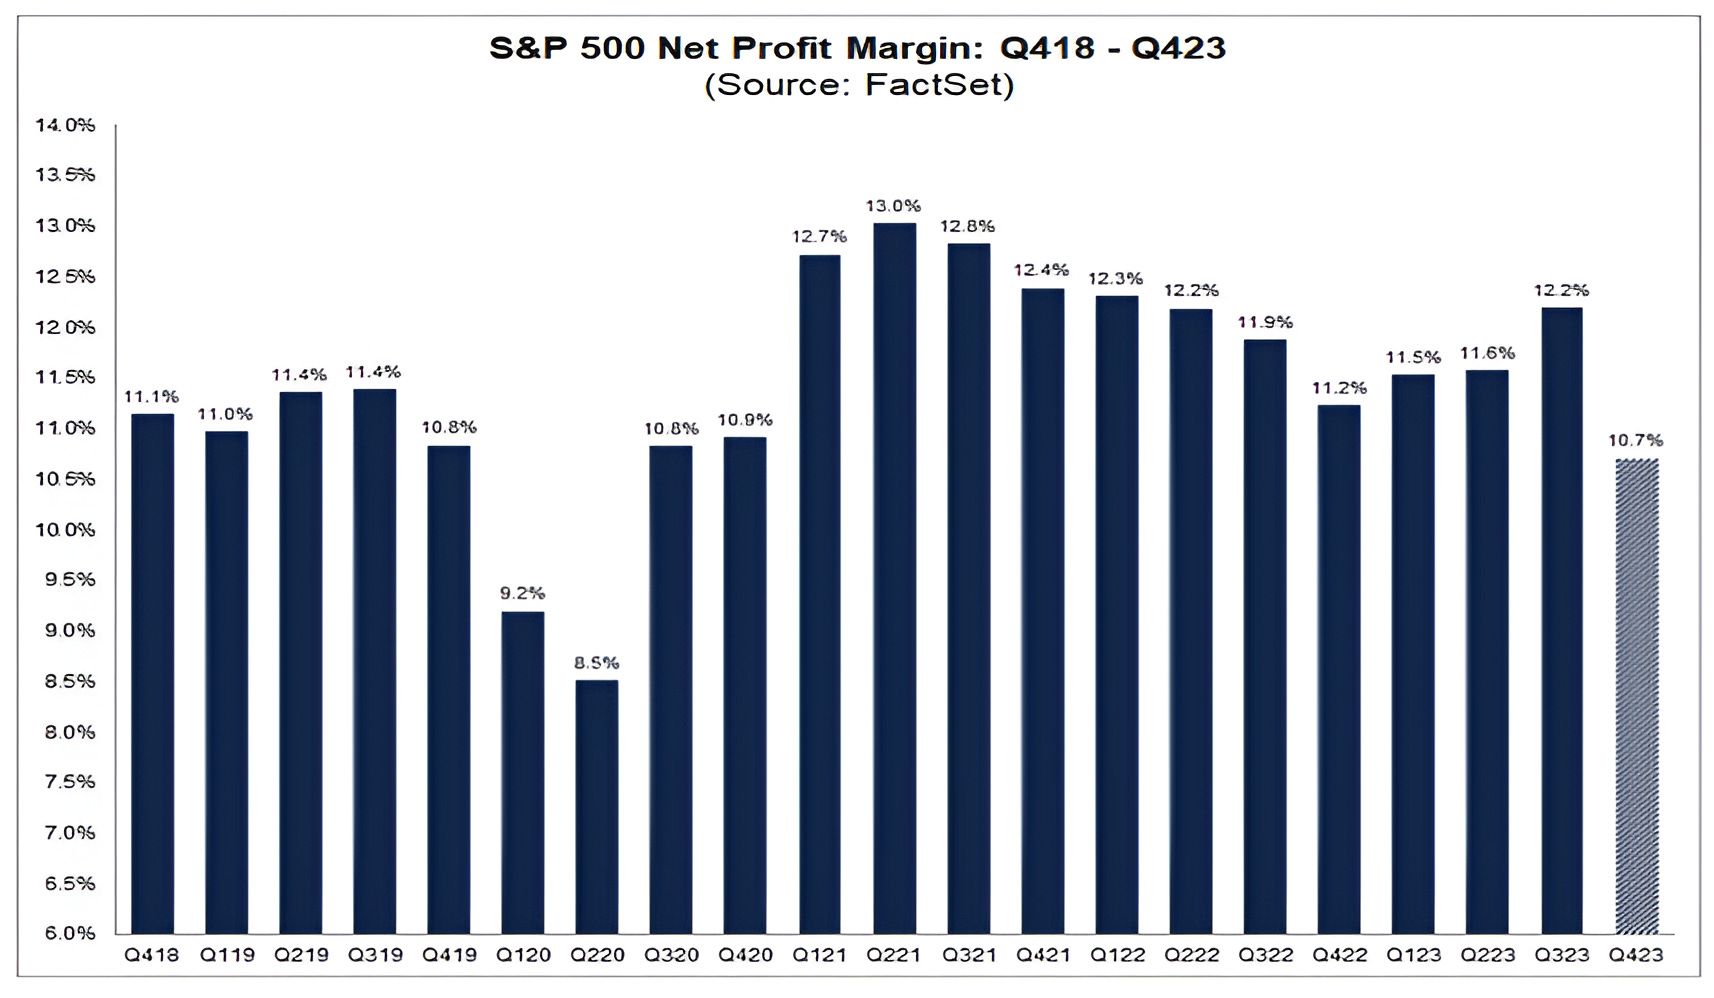
All the while, US corporate margins hit record levels.
Over the past year, despite the lack of earnings growth, margins remained somewhat resilient.
However, in Q4 (again with only 10% of companies having reported), corporate margins have dropped to pre-pandemic levels.
When we consider margins there are two main factors: 1) variable expenses - these are the cost it requires for each additional unit sold; 2) fixed expenses - these, as their name implies, are relatively consistent regardless of sales.
During the post-pandemic period, variable expenses rose. This was due to higher energy prices, shipping costs and in some cases labor. Because of demand, companies were able to pass along these expenses (and then some).
More recently, as we’ve seen shipping costs, gas prices and commodities expense in general come down, it is likely that either fixed expenses are stubbornly high or demand is not strong enough to justify price.
Neither of these possibilities reflect well on economic strength.
Consumers, in general, seem more “spent up” than “pent up.”
Although the holiday season reflected spending growth, on a real basis (after inflation) growth was minimal if existent. In addition, consumers used more credit than typical for purchases as buy now pay later (“BNPL”) through websites became more common.
If, on the other hand, fixed expenses are high and led to reduced margins, this may mean cost cutting is coming.
Companies have been reluctant to fire workers as they recognized replacement costs are high. As highlighted yesterday, we are beginning to see companies reduce headcount although it hasn’t shown up in employment data.
It may be a stretch to say that low corporate margins are either a result of a weak consumer or will lead to layoffs, but it is something to consider and watch.
Source: FactSet. Through January 19, 2024.
3. Revisiting the Constructive Scenario
As we wrote in “Considering a More Constructive Scenario” (here), unless there is a recession and earnings dramatically disappoint (down 10%+) during 2024, the market may focus on 2025 estimates.
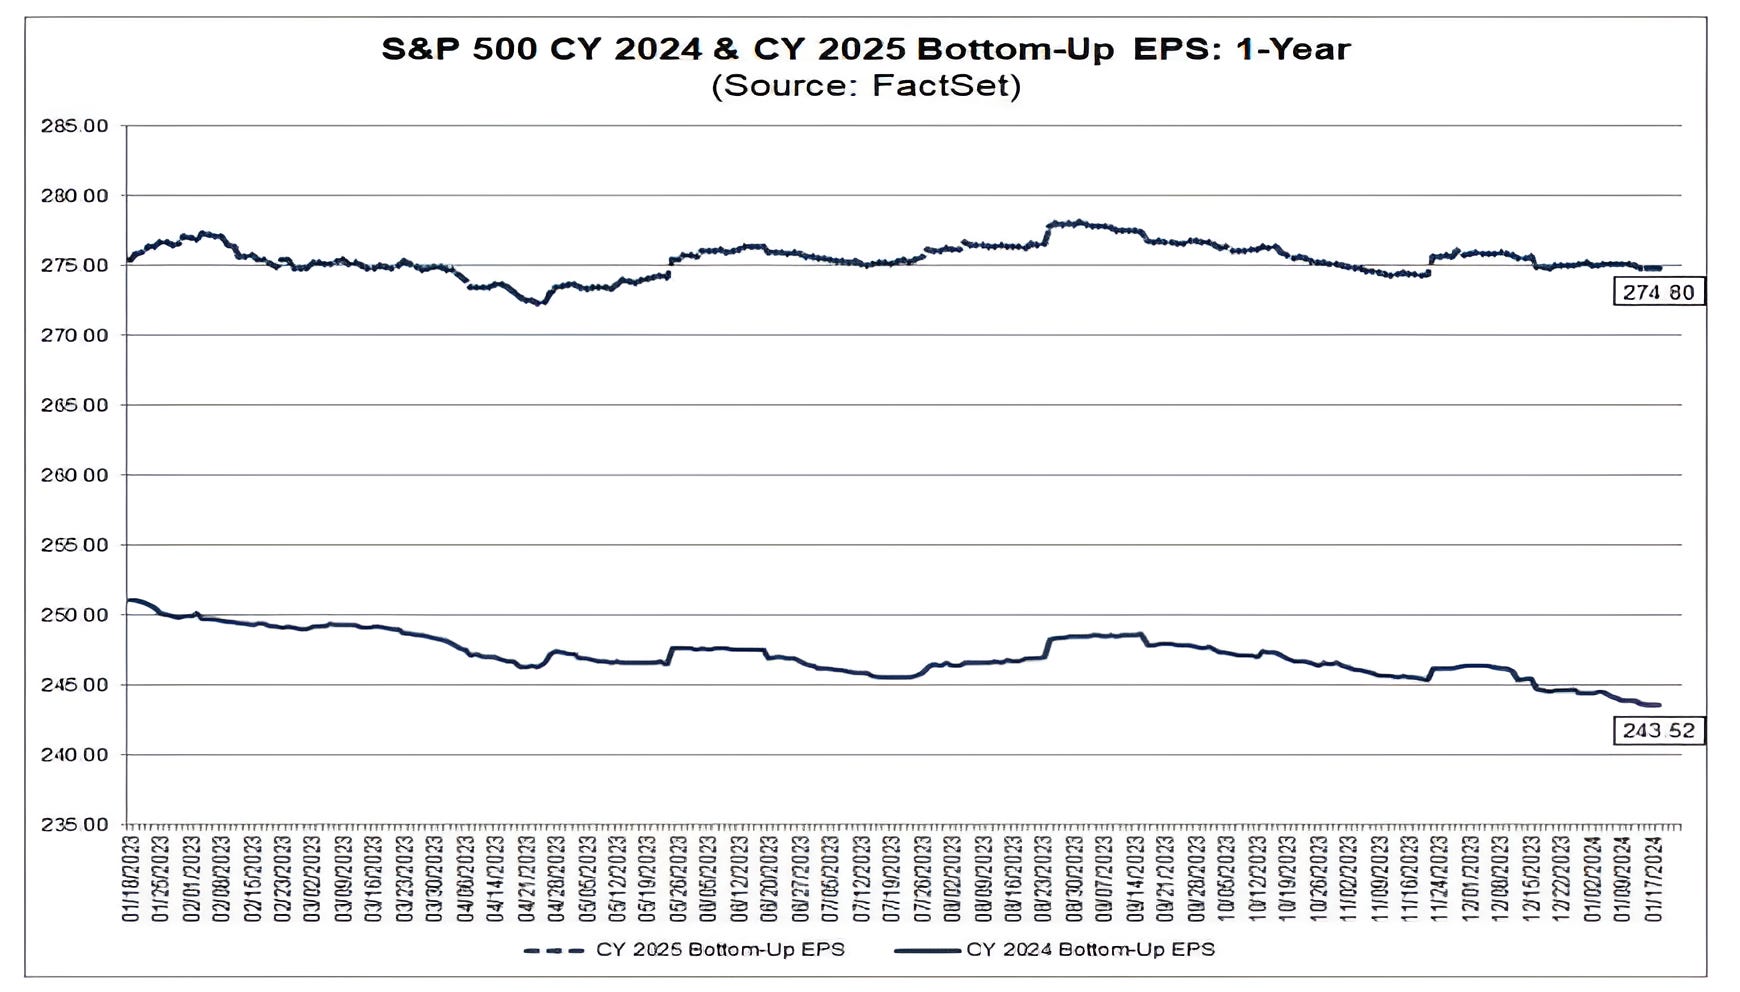
Below is a chart of “bottoms-up” S&P 500 earnings for 2024 (lower line) and 2025 (higher line).
(Bottoms-up earnings consider consensus analyst expectations for all 500 companies in the index, weighted and aggregated by each companies share in the index.)
The current expectation for 2025 S&P 500 earnings is $275.
Although, we believe that 2025 earnings expectations are likely too high, that may not be overly significant.
As we are currently in January 2024 and full year earnings expectations are $243 (10-11% growth depending on final 2023 earnings) and declining, the market is continuing to move higher and as stated above, this doesn’t seem to be the focus right now (Fed, soft-landing, new highs).
In fact, 2024 estimates have dropped from over $250 to below $244 while the S&P 500 has increased by over 25%.
It clearly doesn’t matter that we (and many others) think 2024 earnings will be closer to 6-8% growth (~$235) than the current $244 estimate.
A year from now, 2025 estimates may be around $265 -$270.
Sitting on December 31, 2024, an analyst might look at 2025 earnings expectations and apply today’s 19x multiple (low rates, soft landing and earnings growth = above average multiple) and conclude the S&P 500 should be trading between 5100 - 5200.
This would represent 5-7% growth from today’s level of 4850.
Although we think this is achievable (in line with our base case), we do not believe it’s a straight path from here to there. There will likely be better buying opportunities along the way. (This is why we are hedged through put spreads and have increased cash).
Furthermore, in line with US Presidential election years (see Chart 5 here), we think the gains will occur in the second half of the year. (Past performance is not indicative of future results).
Source: Bloomberg. Through year-to-date 2024.
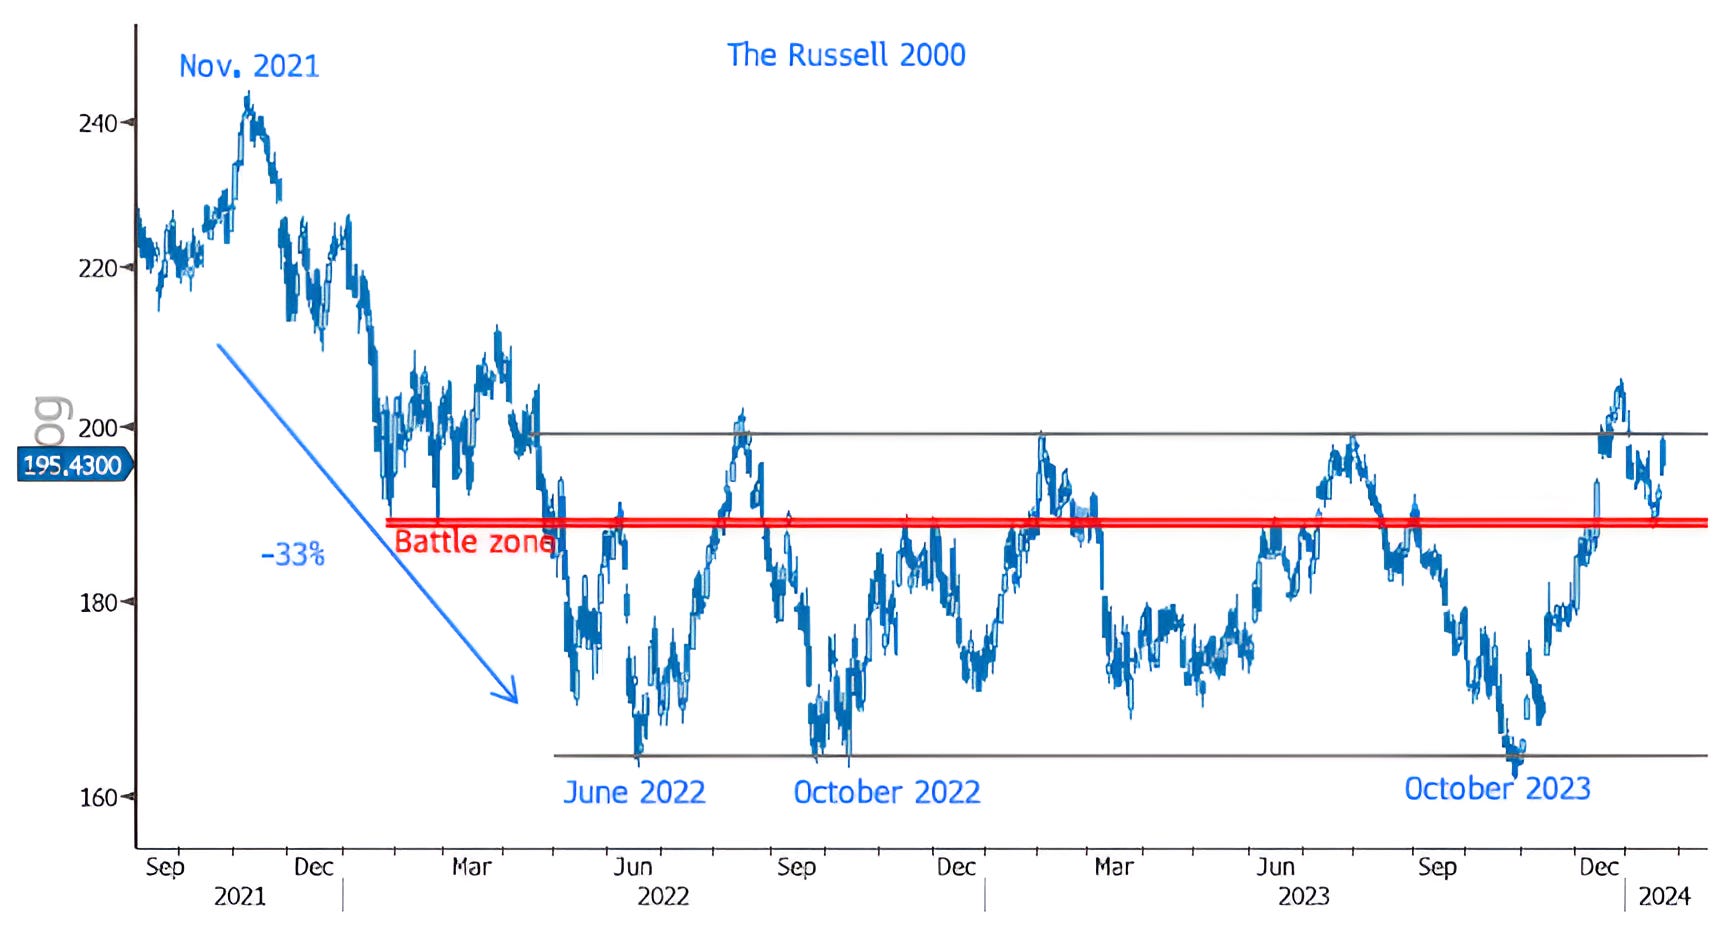
4. Continuing to Watch Small Caps
Small caps might be the key to unlocking the 2024 mystery of US equities.
In general, Small Caps are seen as more economically sensitive than their large- and mega-cap cousins.
If a no landing (continued growth) or soft landing (slowing, but continued growth) becomes the economic reality, Small Caps which have been trading sideways and are at a level they first hit (on their way down) two years ago, should experience upside.
Furthermore there’s this (from Charlie Bilello):
The S&P 500 closed at an all-time high last Friday while the Russell 2000 Small Cap Index was still 20.4% below its peak.
That's the largest Russell 2000 drawdown ever with the S&P 500 at an all-time high.
What happened following the 3 previous largest Russell 2000 drawdowns when the S&P 500 was at a record high?
Both indices rallied higher over the next year with the Russell 2000 outperforming and joining the S&P 500 at an all-time high.
1) April 7, 1999 (-19.2% Russell 2000 drawdown): S&P 500 gained 14.3% over the next year and R2k gained 36.5%.
2) February 13, 1991 (-13.5% Russell 2000 drawdown): S&P 500 gained 12.1% over the next year and R2k gained 35.5%.
3) January 21, 1985 (-13.3% Russell 2000 drawdown): S&P 500 gained 17.4% over the next year and R2k gained 18.2%.
(Past performance is not indicative of future results)
Source: Bloomberg. Through year-to-date 2024.
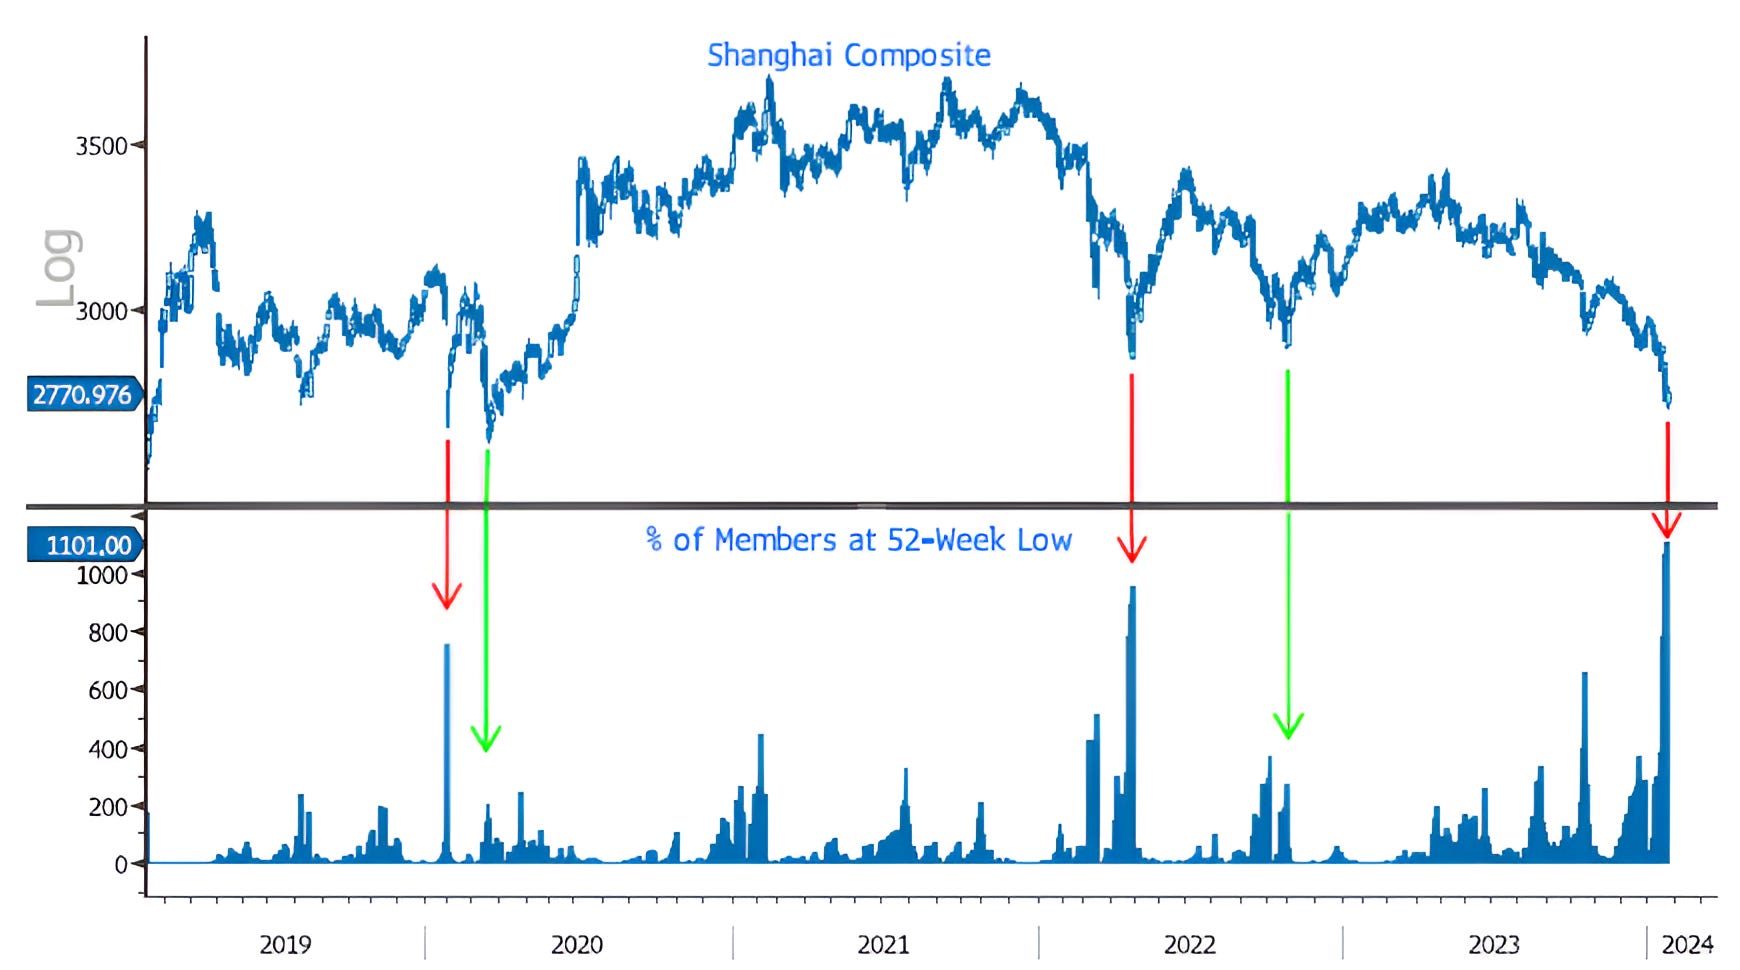
5. Chinese Equities
After continuing to underperform, Chinese equities bounced overnight as authorities are considering a rescue package to restore confidence.
Below is a chart of the Shanghai Composite (top panel) with the % of members at a 52-week low (bottom panel). (H/t Chris Verrone).
Typically, after a bounce, when there is a spike higher in the number of companies hitting a 52-week low (red arrow), the Index “re-tests” the low by revisiting it. (Past performance is not indicative of future results)
However, on the “re-test,” fewer members are making new lows. The positive divergence which includes the same / lower price with fewer shares making new lows is often seen as a more sustainable entry point than the initial low.