Beauty and the Beat!
The "One, Big, Beautiful Bill" is big, but not beautiful. It has passed through the House, but not the Senate. Passage, rejection and revisions have economic and market implications. Let's dig in...
As they say, Beauty is in the Eye of the Beholder.
What this means is that beauty is subjective. What may be beautiful to you, may not necessarily be beautiful to me.
From the first time that I saw Trump Tower in New York in the early 1980s and Trump’s Taj Mahal in Atlantic City in the early 1990s, I knew that my view of beauty differed from that of our current president.
And so we find ourselves with the One, Big, Beautiful Bill (the “OBBB”) - where beauty is definitely in the eye of the beholder, subjectivity seems somewhat partisan and my personal view of beauty, once again, differs from that of the President.
There are generally three perspectives on the One, Big, Beautiful Bill:
Democrats: They believe this is an awful bill that will disproportionately raise taxes on and decrease benefits for those most in need.
“Tea Party” Republicans: These are the Republicans that are focused on the deficit who, in general, were initially elected during the Obama era to push back on profligate spending and the affordable Care Act (“Obamacare”). They believe that this bill will add too much to the US deficit.
Trump Republicans: They believe the bill is “misunderstood” and that the budget office (the people that evaluate these things) has over-penalized some aspects of the bill and ignored the revenues from tariffs in their scoring.
They are all correct to a certain extent.
We will take a look at the OBBB in chart 3, below.
Despite some attention last week to 10-Year Treasury yields (our favorite), the real action may have been in 30-Year Treasury Yields (chart 4, below).
For the most part, equity markets seem to be in “wait and see” mode. We continue to see the possibility of upside (or at least limited downside) through July.
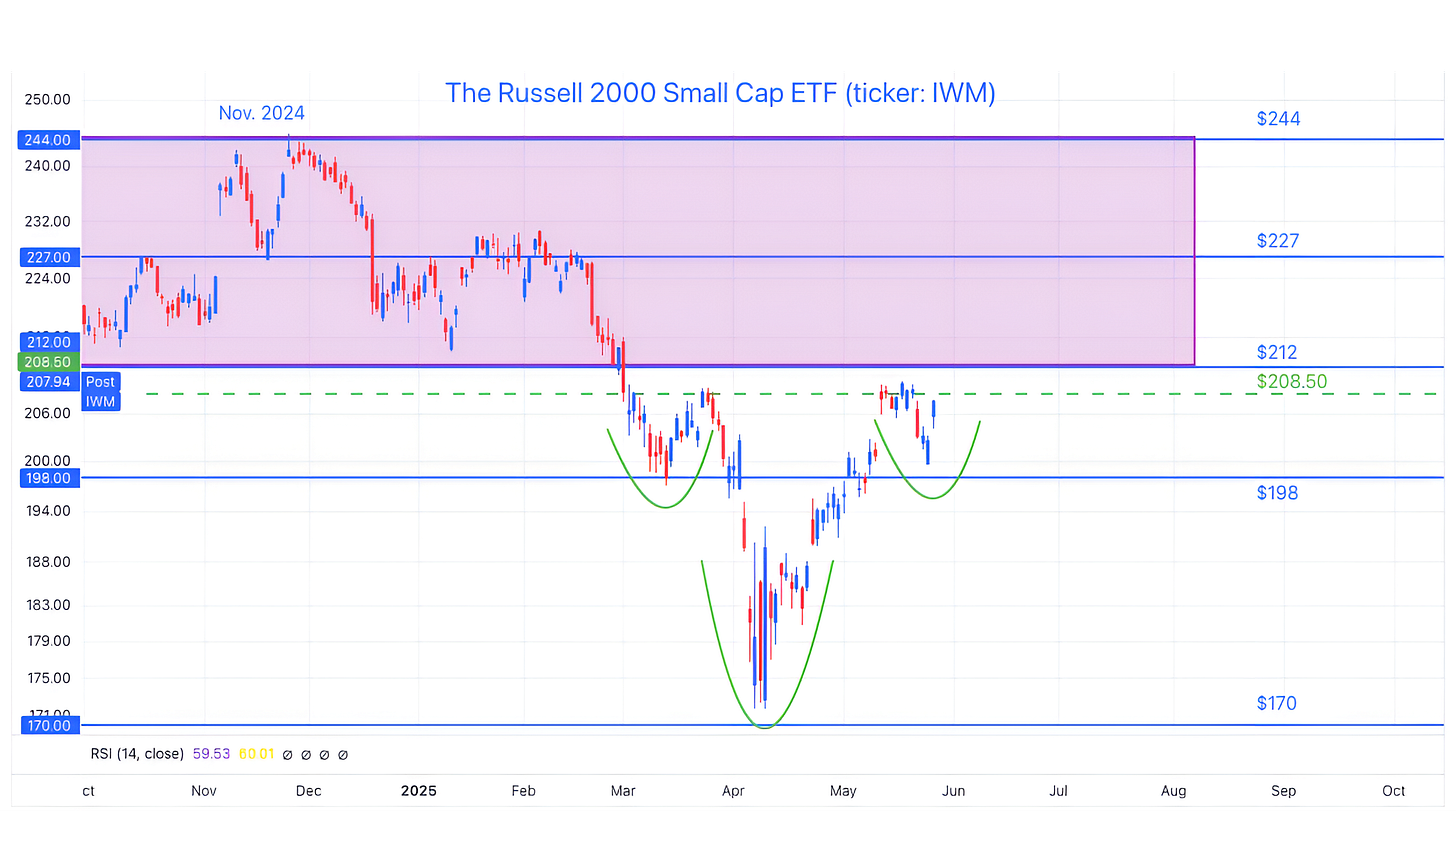
Despite our initial reluctance to embrace the post liberation day v-shaped equity market recovery, we continue to be impressed with the performance in Financials, Industrials and Small Caps (chart 2, below) - three key economic sectors and sectors that we often look to in order to gage broad market strength (and more importantly weakness).
We are continuing to selectively add exposure and we have brought cash down to 15%.
Although our headlines are generally reserved for song names, given the “One, Big, Beautiful Bill,” the Go-Go’s debut album seemed appropriate:
“Beauty and the Beat.”
1. The S&P 500 ETF: Charting the Head and Shoulders
Source: TradingView. Through year-to-date 2025.
The chart above shows the S&P 500 ETF (ticker: SPY).
Two weeks ago, when we last wrote about the S&P 500 (here), we showed the possibility of an inverse “head and shoulders” forming.
When we showed a similar development in the Nasdaq 100, we suggested the possibility that the neckline of the inverse “head and shoulders” would be retested.
In our view, this would have required a 3-5% drop.
With Trump’s announcement of the potential EU tariff increase, there was a 3% drop in the S&P 500 (back to the green dash neckline), but the market did not experience the 5% fall (green arrow) that would have brought it back to the (lower) possible “neckline.”
The question we have is did we get the “neckline” wrong?
In the chart above, we have included our original neckline (blue solid) as well as our revised potential neckline (green dashed).
Why is this important?
If the retest of the “neckline” is complete - as it would be if our revised “neckline” is correct - we could see the continued ascent of the S&P 500 from current levels (no further retest required - possibly just off to the races).
In addition, if this revised view is correct, it would lead to a higher upside target. Our revised target would be 660 (+11%) (6600 on the S&P 500) rather than 646 that we published two weeks ago.
We believe that the first confirmation of our revised scenario would be the S&P 500 moving above its 2-week old congestion island (the recent activity above the dashed green line on the chart above).
We will be watching.
(This is not a recommendation to buy or sell any security and is not investment advice. Past performance is not indicative of future results. Please do your own research and due diligence).
2. Using Small Caps as a Signal
Source: TradingView. Through year-to-date 2025.
The chart above shows the Russell 2000 Small Caps ETF (ticker: IWM).
Similar to the S&P 500 and the Nasdaq 100 the Small Caps seem to be forming an inverse “head and shoulders” pattern; however, unlike the S&P 500 and the Nasdaq 100, the Small Caps have not yet moved above their neckline.
There are three important aspects to this:
We believe that if the Small Caps move above their neckline - we would likely view it as a signal that the patterns in the S&P 500 and Nasdaq 100 have been confirmed. (Upside, here we come)
If the Small Caps move above their neckline, the upside target for the Small Cap ETF would be $244 - the top end of the prior range.
(As a reminder, an inverse head and shoulders target = neckline-bottom of the head+neckline; in the case of the Russell 2000 Small Caps ETF 208.50-173.00+208.50=244.00).
If the our Russell 2000 Small Caps ETF target is correct, it would provide 17% upside rather than 11% with our S&P 500 target.
(Past performance is not indicative of future results. This is not a recommendation to buy or sell any security and is not investment advice. Please do your own due diligence).
3. One, Big, Beautiful Bill
Source: Strategas. Through year-to-date 2025.
The chart above shows the spending from the “One, Big, Beautiful Bill” (OBBB) (red bars) along with an assumption of tariff revenues (blue bars).
Most estimates of the cost of the bill don’t consider the revenues from tariffs. This is because President Trump is enacting the tariffs by executive order and not through Congress.
Congress is not passing any tariffs, and, as a result, any revenue from the new tariffs is not included in the current budget baseline or the scoring of the OBBB.
The tariffs assumption above is based on a 10% universal tariff, a 30% China tariff and some sectoral tariffs.
In the chart above, neither of the OBBB cost assumption nor the tariff revenues assumption takes into account growth effects.
Once tariffs are taken into account, the deficit impact is negligible over 10 years.
According to Dan Clifton, the Washington analyst at Strategas, “There is little 10-year deficit difference between letting the tax cuts expire and extending the tax cuts with new tariffs.”
While we won’t debate how the tax cuts are targeted, in our view, the equity market has responded positively (in general) to the near-term stimulus of the OBBB and the bond market (see chart 4, below) has likely reacted to the fact that the US deficit is not being reduced (our concern for some time) rather than because of significant additional spending.
(Past performance is not indicative of future results. This is not a recommendation to buy or sell any security and is not investment advice. Please do your own research and due diligence).
4. 30 Year Treasury Yields: A Troubling Signal?
Source: TradingView. Through year-to-date 2025.
The chart above shows the 30-Year US Treasury Yield.
While the 10-Year US Treasury Yield did not hit the 4.65% level last week that we have been showing as a ceiling level, the 30-Year US Treasury Yield traded near its highest level since prior to the financial crisis in 2007.
I have often said that the US Treasury market has entered a new “regime.”
In the past, we have shown the 10-Year US Treasury Yield often (last time was two weeks ago, chart 4, here) and have expressed our concern (for the last nine months) that the combination of:
US debt outstanding $37 trillion;
the fiscal deficit (chart 4 here); and
the debt maturity wall (chart 1 here)
could lead to significantly higher yields and lower equity prices.
According to Dan Clifton at Strategas, last week’s move in Treasury yields was not necessarily a reaction to the One Big Beautiful Bill, but more of a reflection of the issues above that we have been citing and a lack of austerity to cure them.
“We have long argued that once net interest costs exceed 14% of tax revenue, the bond markets pay attention to US fiscal policy.
Interest costs are currently at 18% of tax revenue.
Adding to this pressure is that Treasury will need to flood the market with debt issuance once the debt ceiling is raised with passage of the tax legislation.
And because of the deficit, at some point Treasury will need to increase long-term bond issuance, which has been on hold for some time.”
We will see if the moves in the 30-Year Treasury Yield foreshadow moves in the 10-Year and if higher yields, should they occur, de-rail the markets ascent and / or the passage of the OBBB in its current form.
(Past performance is not indicative of further results. This is not a recommendation to buy or sell any security and is not investment advice. Please do your own due diligence).
5. I Keep Thinking About this Analog…
Source: Bespoke Investment Group. Through year-to-date 2025.
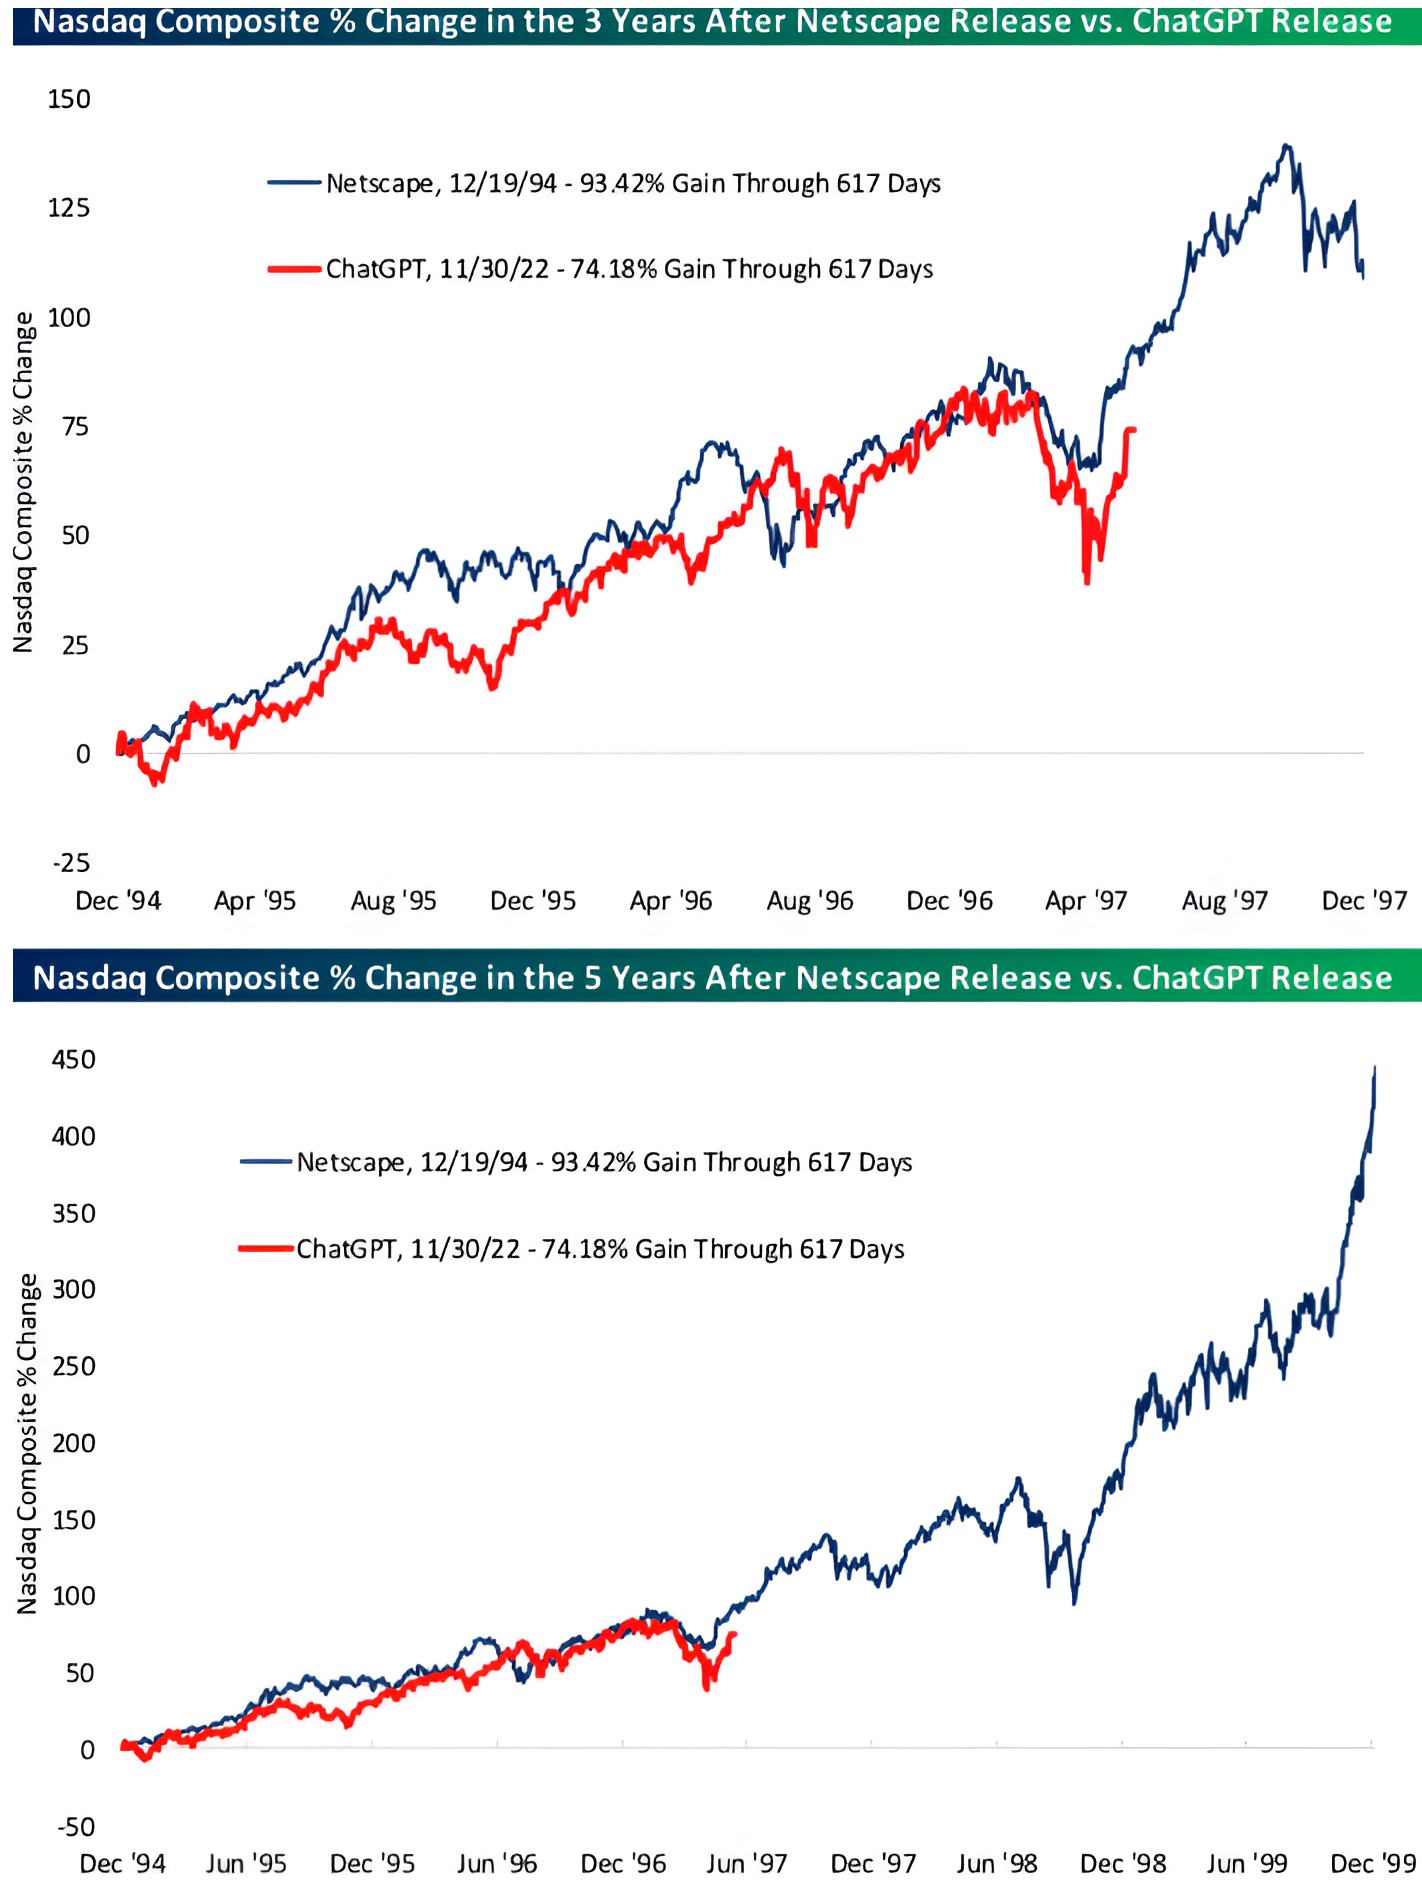
The chart above shows the Nasdaq 100 after the release of Netscape, the first popularized internet browser, in December 1994 (blue line) and the performance of the Nasdaq 100 in the current period since the release of Chat GPT (red line), the first popularized AI agent.
We last showed this chart three months ago (chart 5, here) and it’s amazing how closely the paths have followed.
I recently listened to a podcast with the CEO of Google, Sundar Pichai (spotify link here). His comments struck me:
“This is an entirely new world that's going to be a lot bigger than the world we had last year…
When the internet happened, Google wasn't even around. Right?
…there are companies we don't even know, haven't been started yet, their names aren't known, might be extraordinarily big winners in the AI thing.
So it's going to be, AI is a much bigger landscape, opportunity landscape, than all the previous technologies we have known, combined.”
We showed a chart from Coatue, a late-stage venture manager (chart 4, here) that reflected a similar dynamic.
(Past performance is not indicative of future results. This is not a recommendation to buy or sell any security and is not investment advice. Please do your own research and due diligence).


