

Everything Is Awesome!
With US equities recovering their post-"Liberation Day" losses despite economic volatility, it's easy to question what markets are pricing in. Is it time to buy or sell? Let's dig in...

With the S&P 500 having rallied 10%+ over the past eight trading sessions, it is easy to wonder if I missed something.
Looking at recent headlines:
CNN asks: “Want evidence Trump’s tariffs are upending the global economy? Here it is;”
The New York Times says: “Wall Street Bursts With Anger Over Tariff ‘Stupidity’” (April 9); and
The Wall Street Journal proclaimed: “Dow Headed for Worst April Since 1932 as Investors Send ‘No Confidence’ Signal.” (April 21)
Perhaps the greatest challenge of investing in the time of Trump is separating signal from the noise (and one’s own opinions).
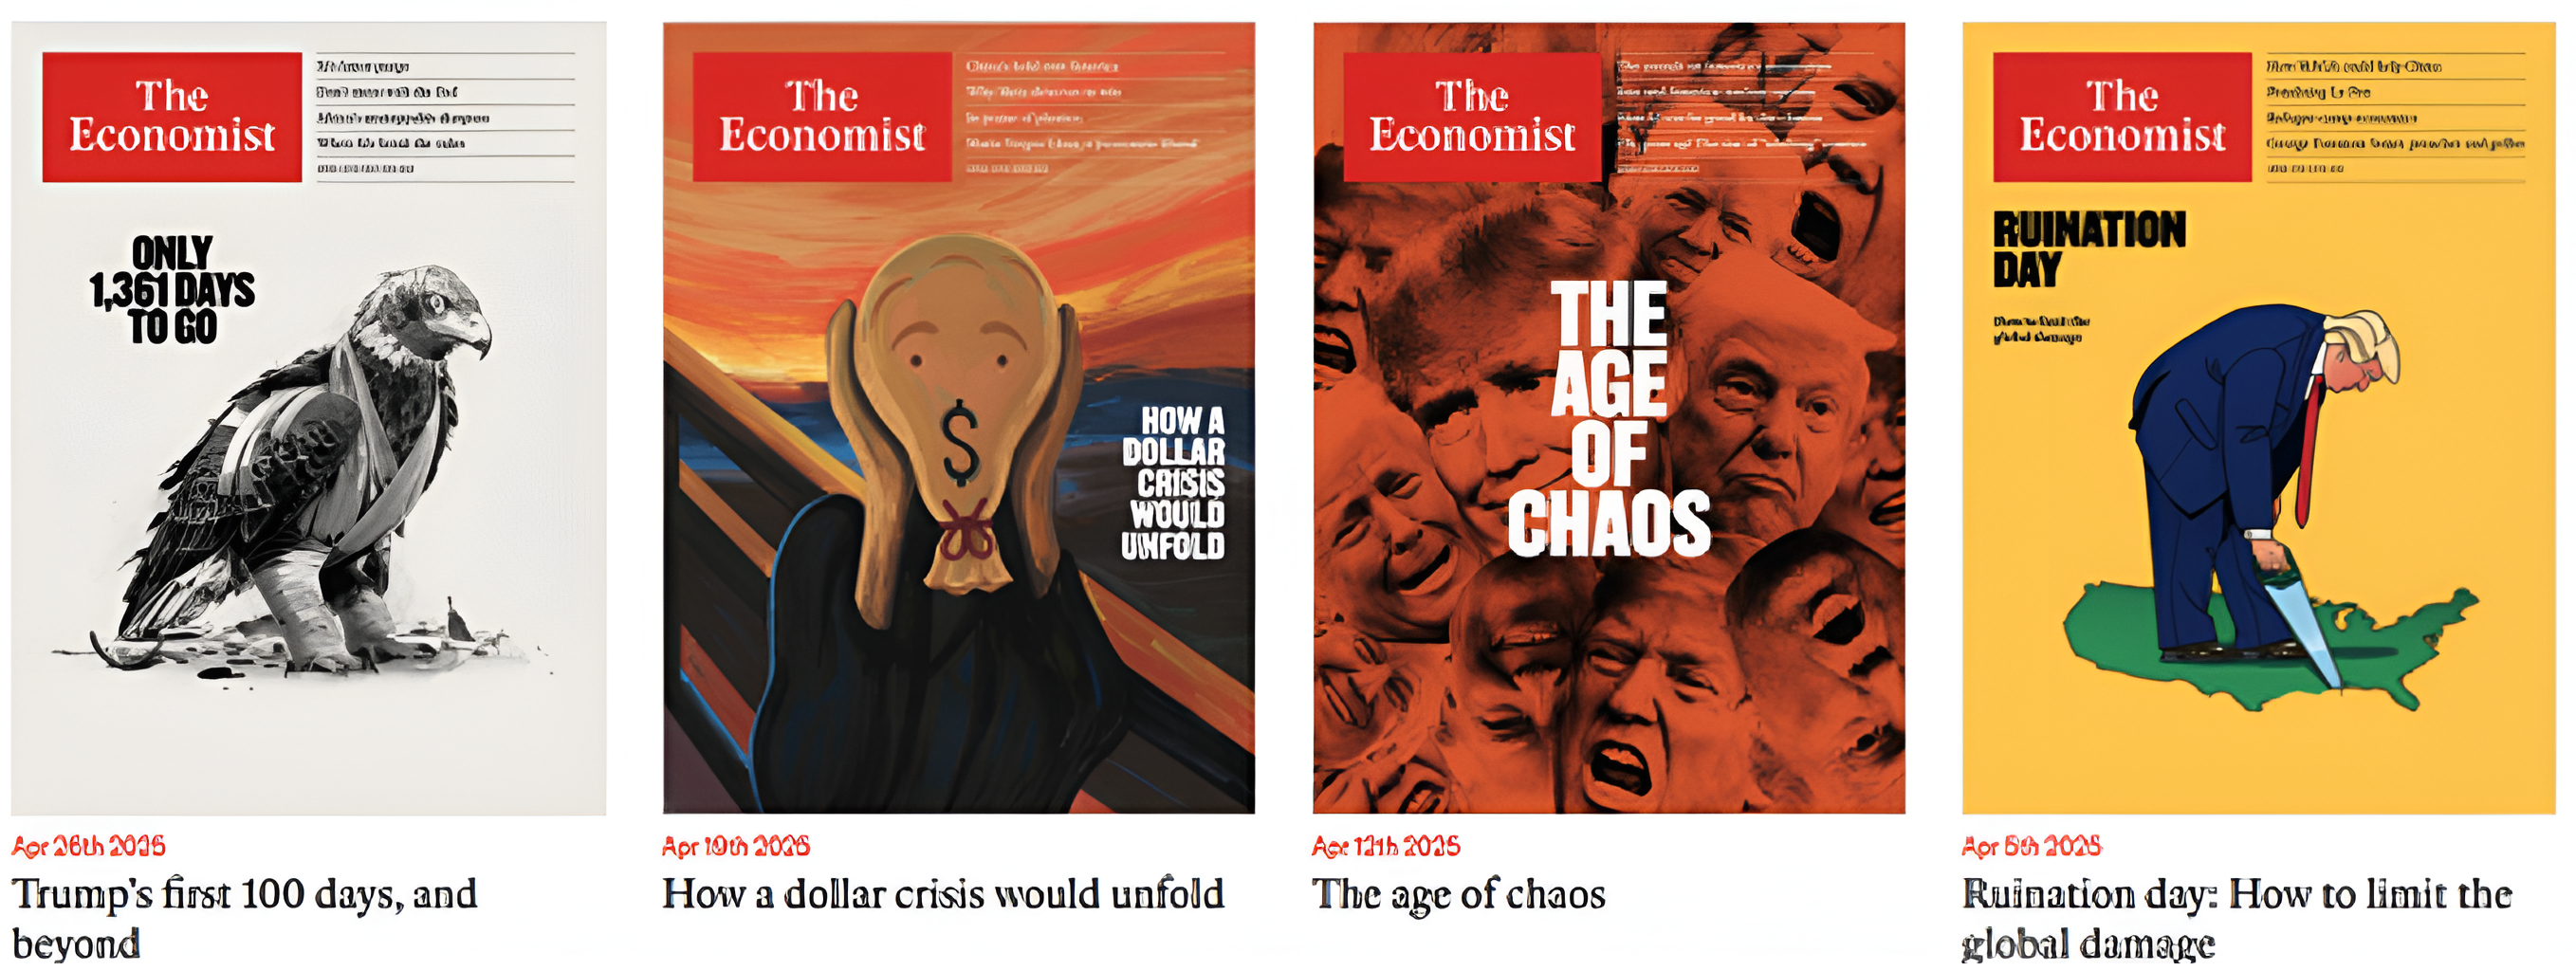
(We have added recent Economist headlines in the picture below - are these signs of a bottom, just as we viewed the Barron’s cover as a sign of the top in mid-December (here)? ).
In this environment (as in most investing environments), we rely on the wisdom of Stanley Druckenmiller:
“Never, ever invest in the present…
You have to visualize the situation 18 months from now, and whatever that is, that’s where the price will be, not where it is today…
You have to look to the future. If you invest in the present, you’re going to get run over!”
In our view, there are two broad 12-18 months scenarios to consider:
Scenario 1: Trump has maintained onerous tariffs on our trading partners.
Despite slowing growth and heightened unemployment, inflation has moved higher and, as a result, the Fed (with its new Chair) has limited ability to ease.
After increasing 4-5% in 2025 to $255 (current expectations 9%, $265), S&P 500 earnings are projected to add another 5% in 2026 to $270.
2027 earnings are expected to grow 5% for a third year ($283) and given the slow earnings growth and stagnation in the economy, investors ascribe a 17-18x multiple on 2027 earnings and justify 4800-5100 on the S&P 500.
Scenario 2: Tariffs settle down at 10% with most trading partners ex-China.
Trading deals include lower tariffs on US goods, greater access to non-US markets and some investment in US manufacturing.
Chinese tariffs come down and despite tension, there is detente.
Inflation from tariffs is seen as “transitory.”
The Fed cuts rates in June and one more time before the end of 2025. The Treasury helps contain 10-Year Yields (but doesn’t call it QE - see below).
Trump is able to pass a tax cut that doesn’t lower taxes as much as he wants, but he declares victory and calls it the greatest middle class tax cut ever.
Despite S&P 500 earnings slightly missing current 2025 expectations ($260 vs. $265 expected); due to a combination of tax cuts, contained 10-Year yields and easier monetary policy, 2026 earnings are expected to grow 10% to $285 and investors price in another 10% for 2027 to $315.
Investors are willing to place a 20x multiple on 2027 earnings and the S&P 500 rallies to 6300 (12-18 months from now).
While I can accept scenario two as a more probable outcome: a) I don’t think it happens in a straight line (there will be volatility); and b) it seems ~90% priced in at current levels.
In other words, even if scenario two is somewhat accurate and 6300 is an appropriate level a year from now, it is difficult for me today to justify a multiple of higher than 18x (~5640) or 18.5x (~5800) on 2027 possible earnings.
With the S&P 500 at 5600 (as of this writing), there is limited scope for upside - even in an optimistic scenario.
With about 20% cash (still above average for us) in our portfolios some exposure to Europe, EM, some dividend shares and selective growth (internet security) in addition to our core holdings - we are not meaningfully adding or selling at current levels.
With all of that written, there are two (non-obvious) developments we are watching that give us some confidence in the second (more optimistic) scenario:
Markets seem more concerned with growth than inflation.
Very simply, watching the depressed price of oil - in our view - is a reflection of growth concerns and is disinflationary.
Furthermore, Growth (Chart 1, below) - which counterintuitively outperforms in periods of low growth has outperformed.
The good news is that if the core issue is growth (rather than inflation), this will provide scope for the Fed to ease.
Yesterday, the Treasury, in its Quarterly Announcement of Refunding Operations, the Treasury wrote (here):
“Given the success of the buyback program since its launch last year, Treasury believes it is an appropriate time to consider ways to improve its efficacy.
Accordingly, Treasury will evaluate a broad range of possible enhancements such as: changes to maximum purchase amounts, buyback operation scheduling and frequency, security eligibility, maturity bucket composition, execution process, and counterparty eligibility.
In considering these options, Treasury will be guided by the objective of financing the government at the lowest cost over time.”
If this happens, this may be the QE (but don’t call it QE) I have been looking for as a solution to elevated 10-Year yields; overall Interest expense (see Chart 4); refinancing risk and equity market volatility.
This would be the Treasury rather than the Fed making bond purchases (essentially QE).
As a reminder, we viewed the hand-off from Treasury Secretary Yellen - who in our view had used a number of “stealth liquidity” measures in 2023 and 2024 to help maintain economic growth and placate markets - to Treasury Secretary Bessent as a risk as we entered 2025.
This announcement, in our view, may mean that Treasury Secretary Bessent may be finding some liquidity tricks of his own.
“Everything is Awesome!”
1. Growth Outperforming
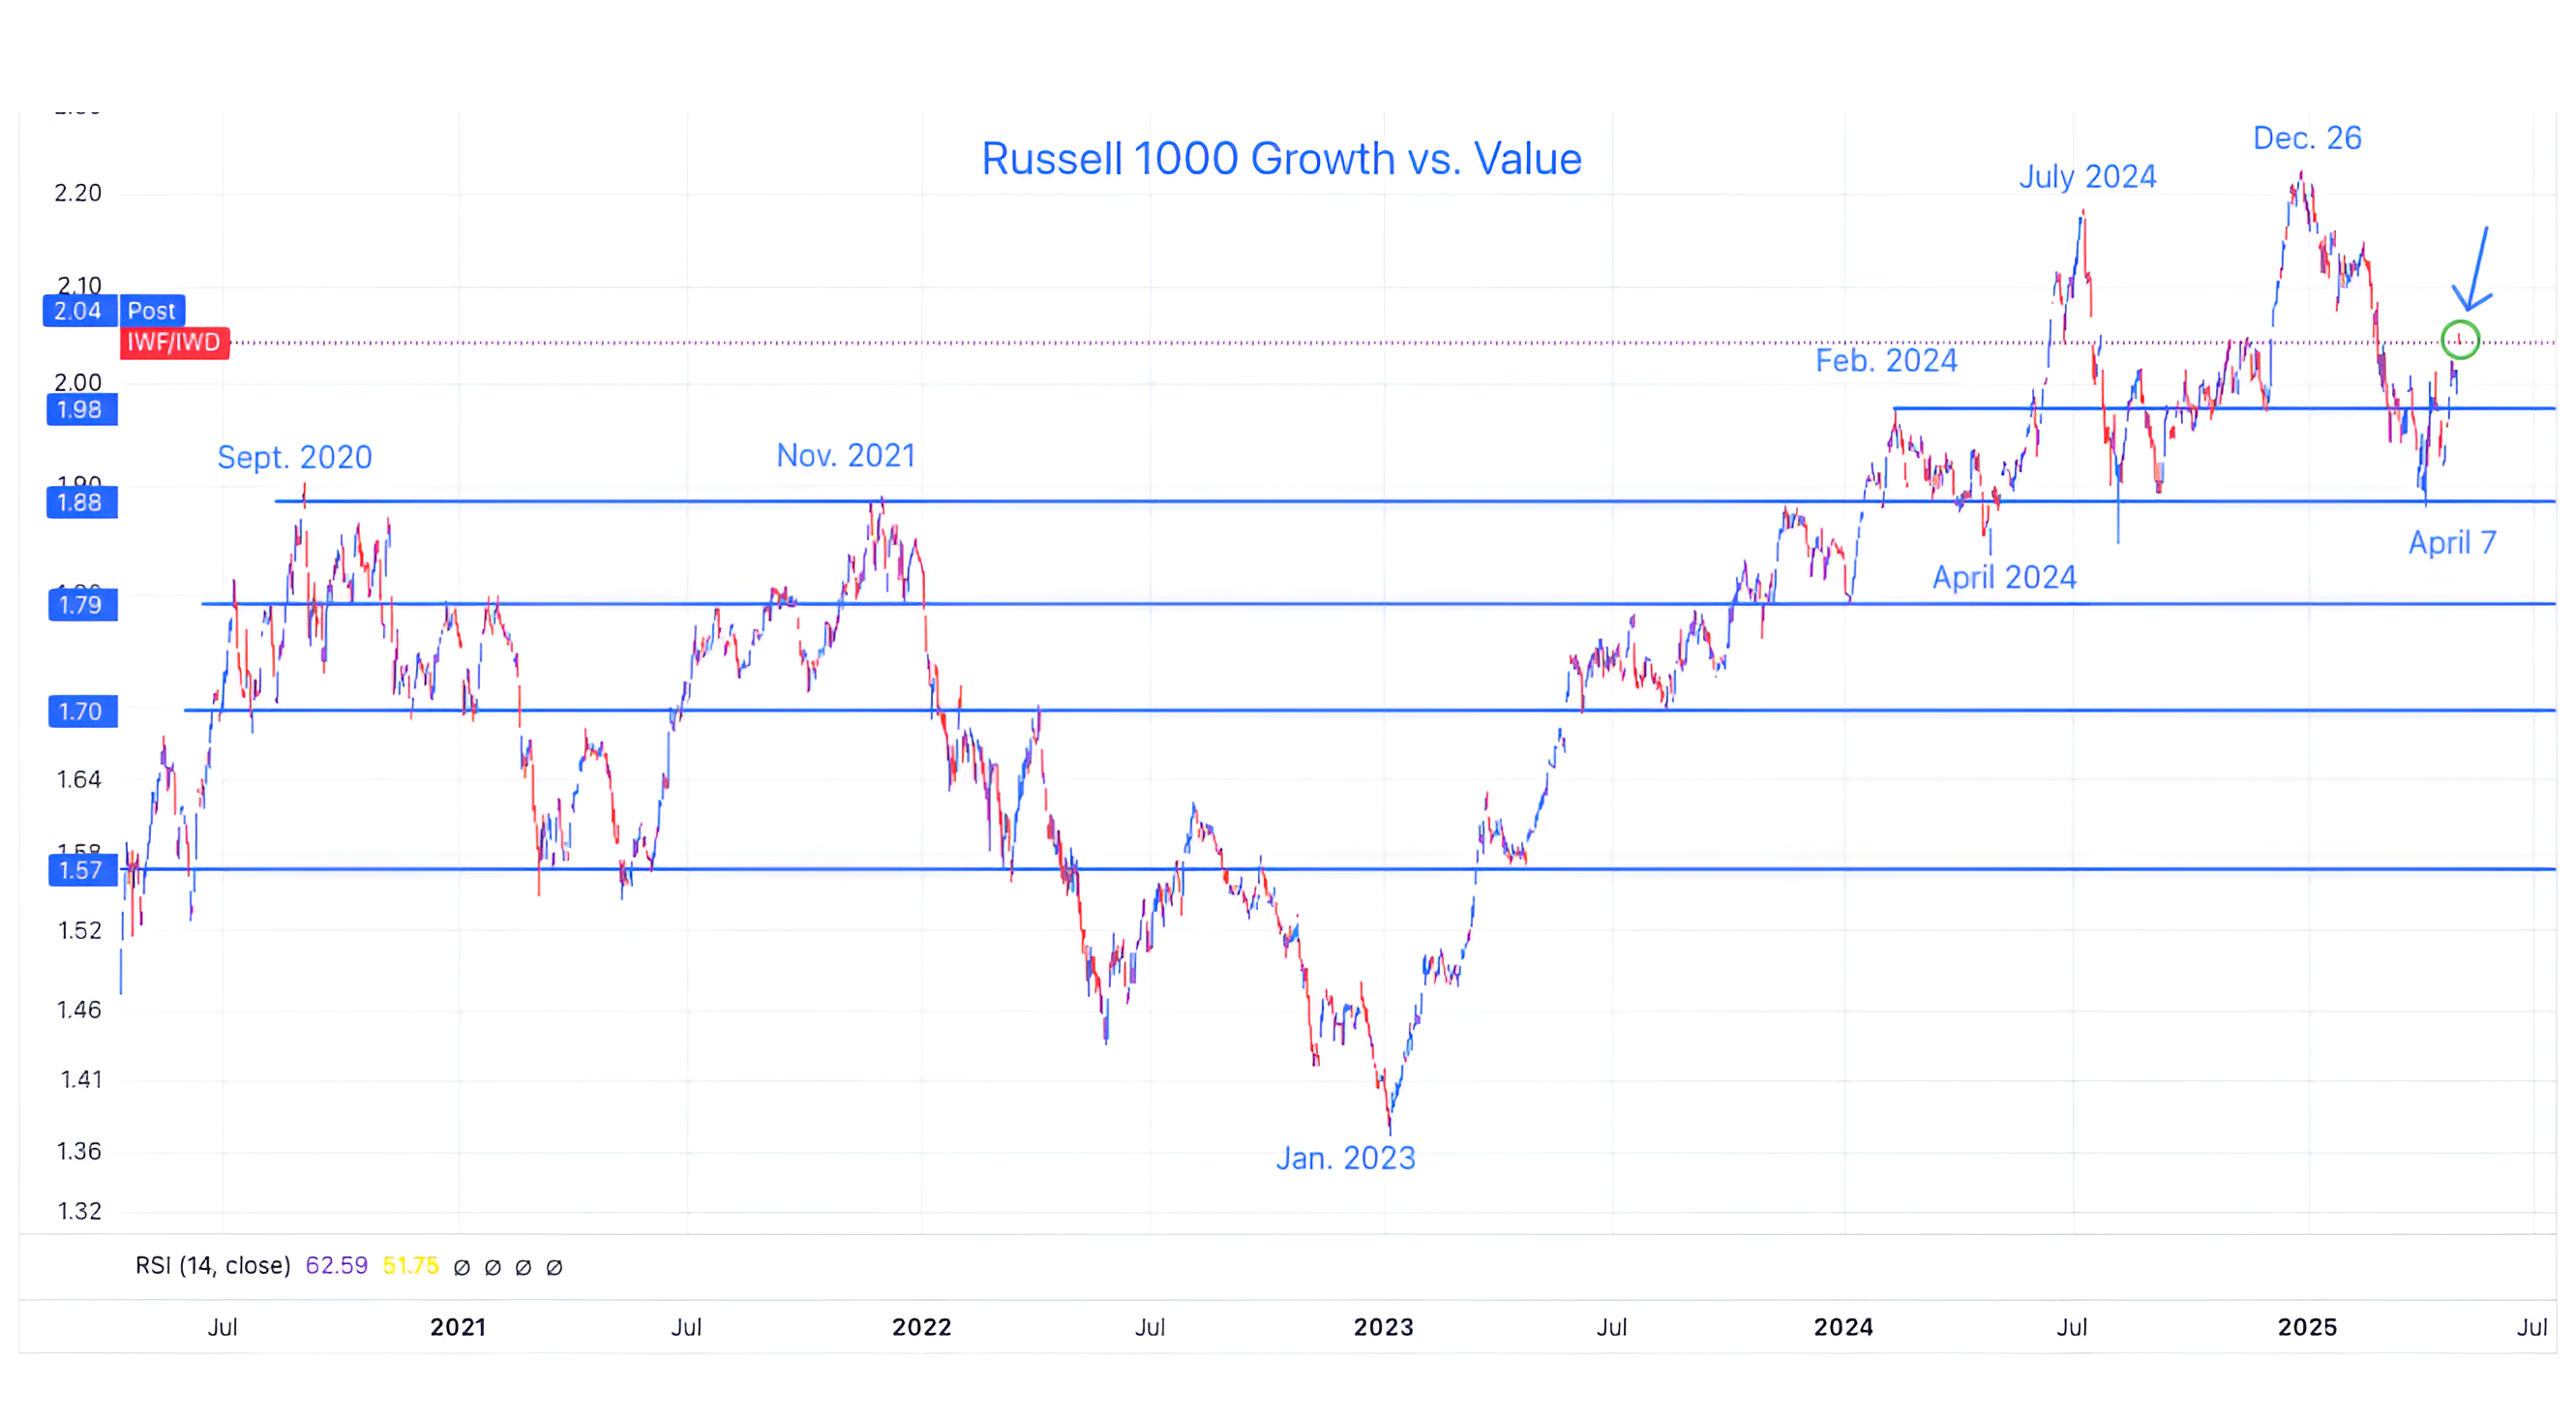
Source: TradingView. Through year-to-date 2025.
The chart above shows the Russell 1000 Growth ETF (ticker: IWF) relative to the Russell 1000 Value ETF (ticker: IWD).
When the chart is moving higher, Growth is outperforming and when it’s moving lower, Value is outperforming.
When does Value typically outperform?
In high growth environments. Like the period after July 2024 when the Fed was easing, but given economic conditions, perhaps investors believed they were over-stimulating.
In Recessionary (and fear of recession) periods. Through 2022 as the Fed was hiking rates, there was fear of a recession.
Growth typically does well in moderate growth environments when the Fed can ease but recessionary fears are contained.
We see the bounce from the April 7 low in the Growth to Value relationship and today’s move above the recent range as a reflection that the equity market is pricing in a slow growth environment that will be supported by monetary policy. (Fed put).
(This is not a recommendation to buy or sell any security and is not investment advice. Past performance is not indicative of future results. Please do your own research and due diligence).
2. Let’s Revisit Earnings in a Recession…
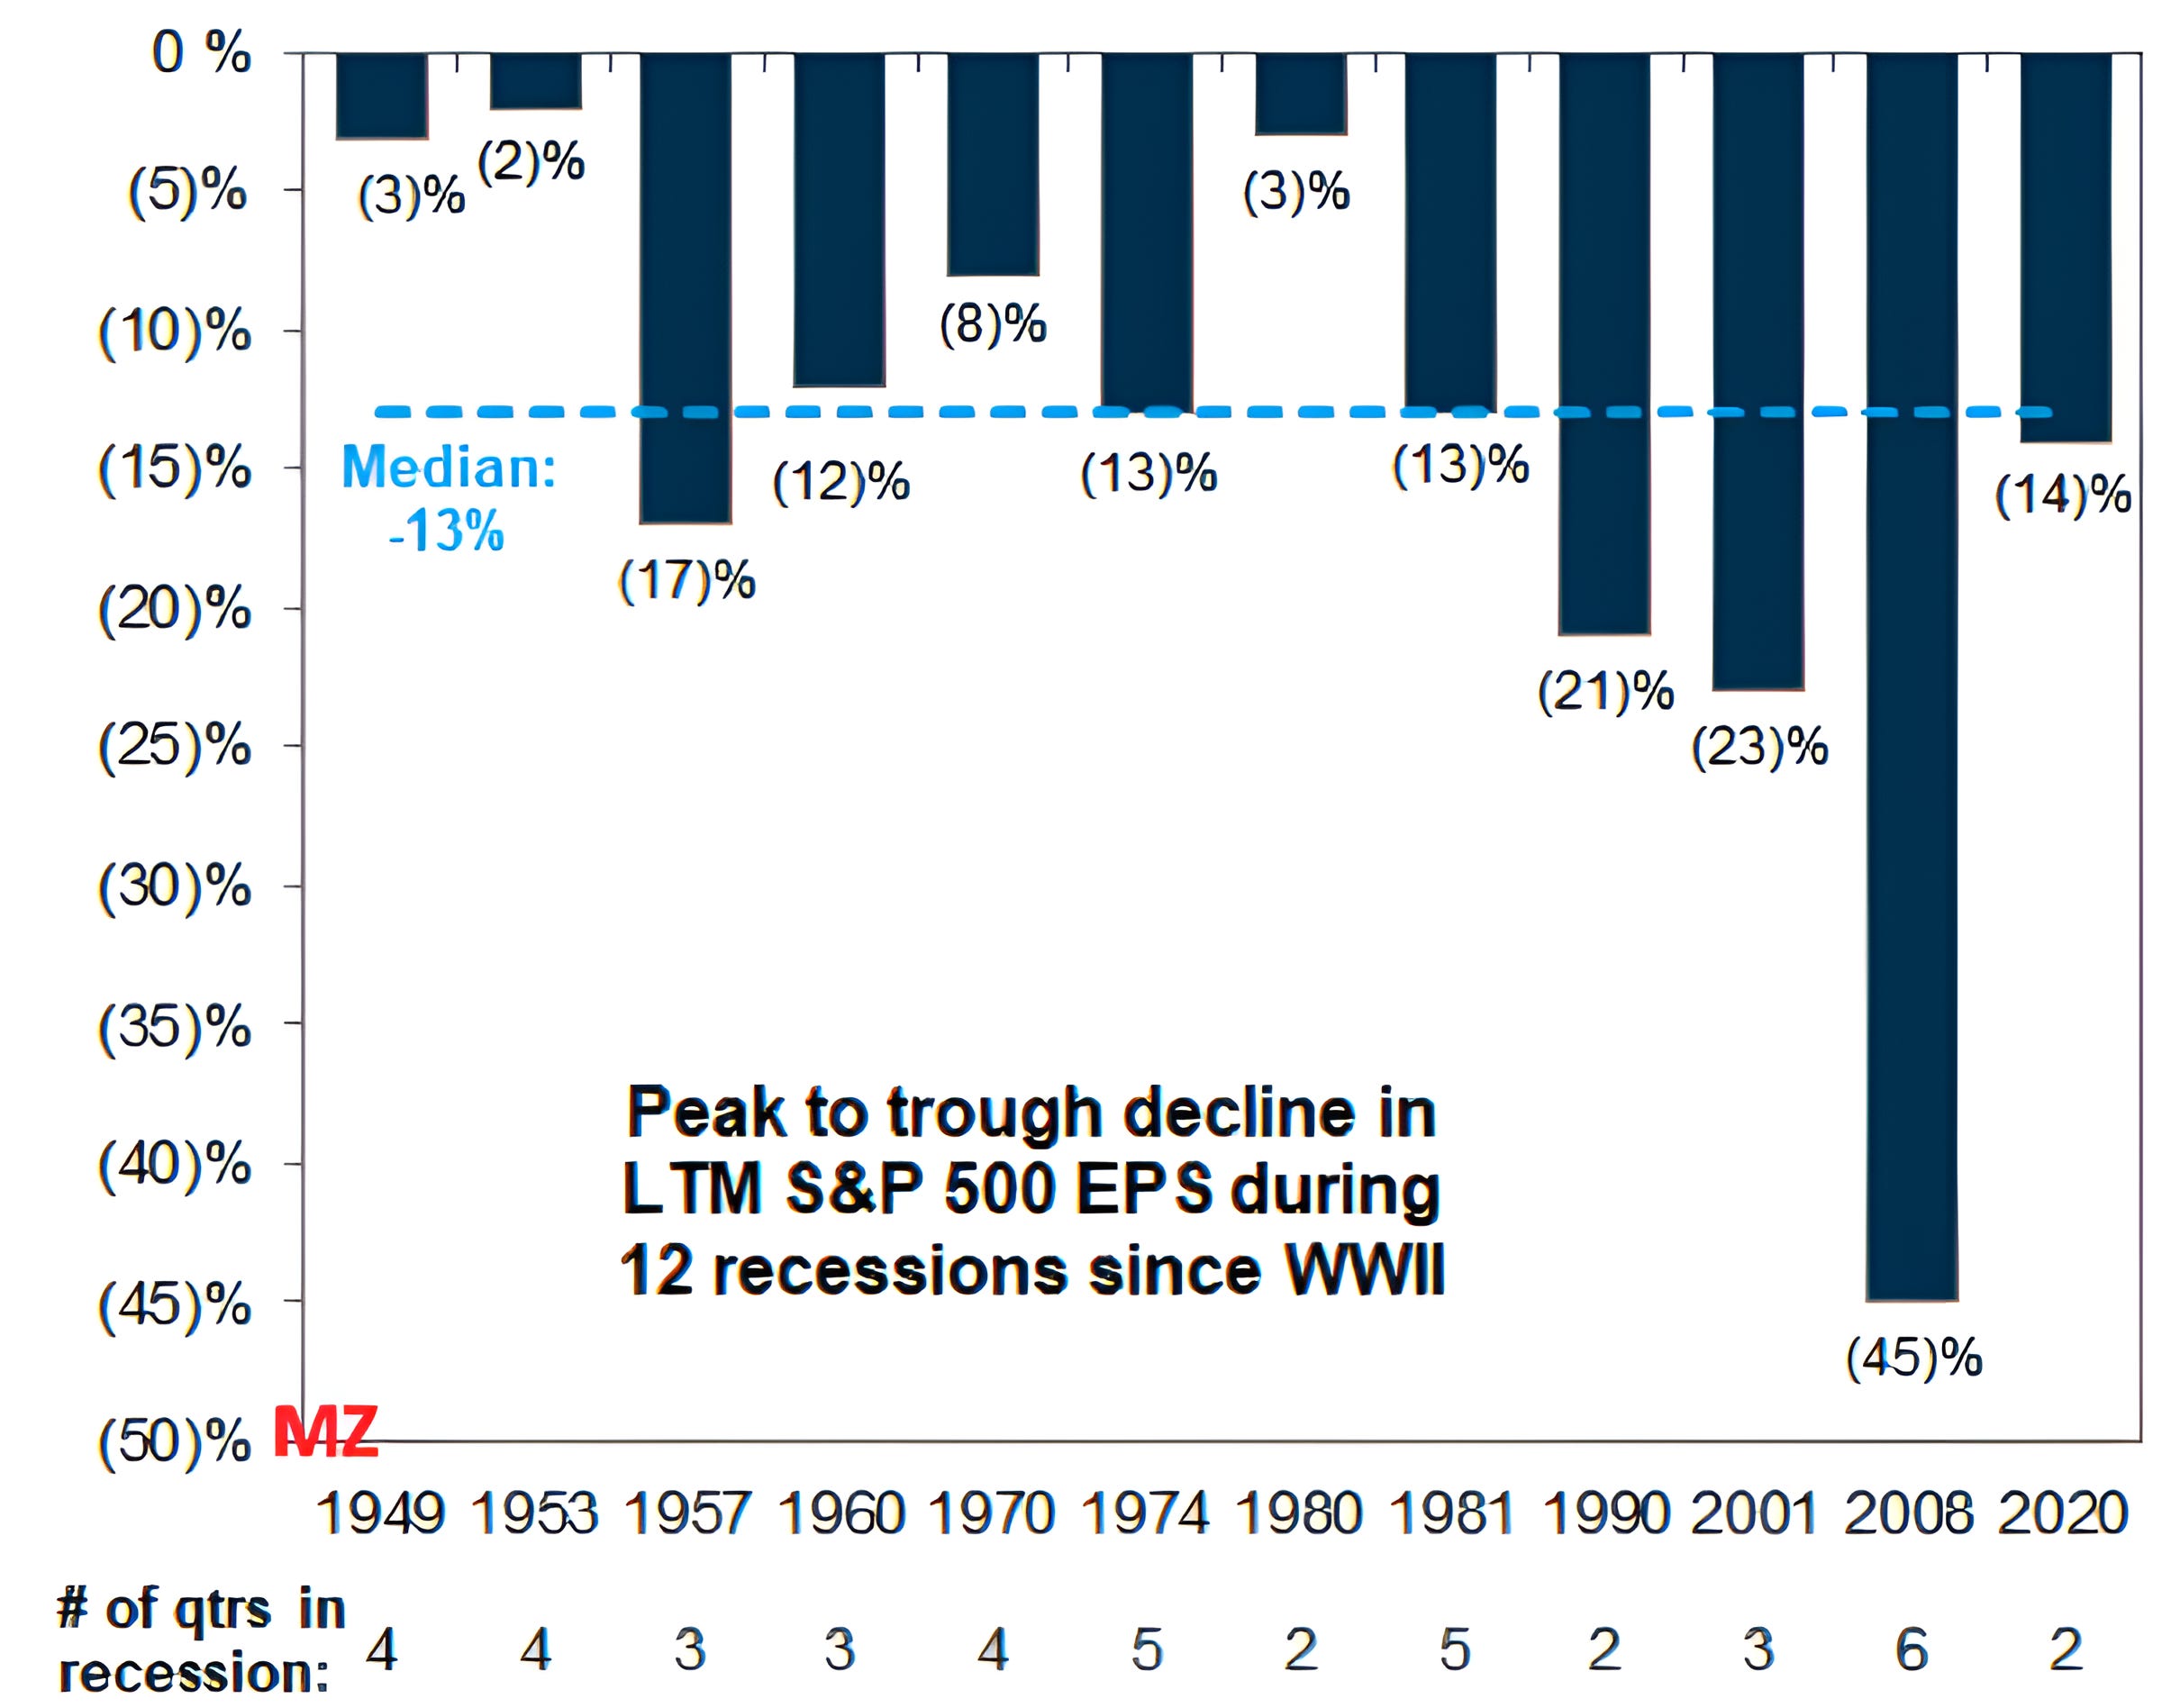
Source: Goldman Sachs. Through year-to-date 2025.
The chart above shows S&P 500 earnings declines in recessionary periods since World War 2.
Given yesterday’s negative GDP print (despite the noise), we wanted to revisit this chart. (We originally showed this in Chart 2 here).
Even if the positive scenario that we presented in our introduction is the more accurate of the two, it is possible that with all of the “noise” surrounding the tariff policy that the US experiences at least two (maybe three) consecutive quarters of negative GDP growth (I know it’s not the technical definition of a recession).
If that were two occur, in our view, two things may be likely:
Although the median earnings drawdown has been -13%, there have been past instances when the earnings decline was much less severe than the median. Given the current environment, our base case is that earnings will slow but not decline meaningfully.
Investors will “look through” the earnings slowdown (or decline) towards a better earnings environment (what will the world look like in 18 months), particularly if they see the Fed easing and the likelihood of a tax cut.
That being said, we continue to believe that 2025 and 2026 earnings expectations of $265 and $302, respectively are too high.
Furthermore, even applying a premium multiple of 19x to current 2026 earnings (the long-term average is 16.5x) and achieving a target of 5750 provides limited upside (2.7%) from today’s closing level of 5600.
(Past performance is not indicative of future results. This is not a recommendation to buy or sell any security and is not investment advice. Please do your own due diligence).
3. What’s the Average Stock “Saying”?
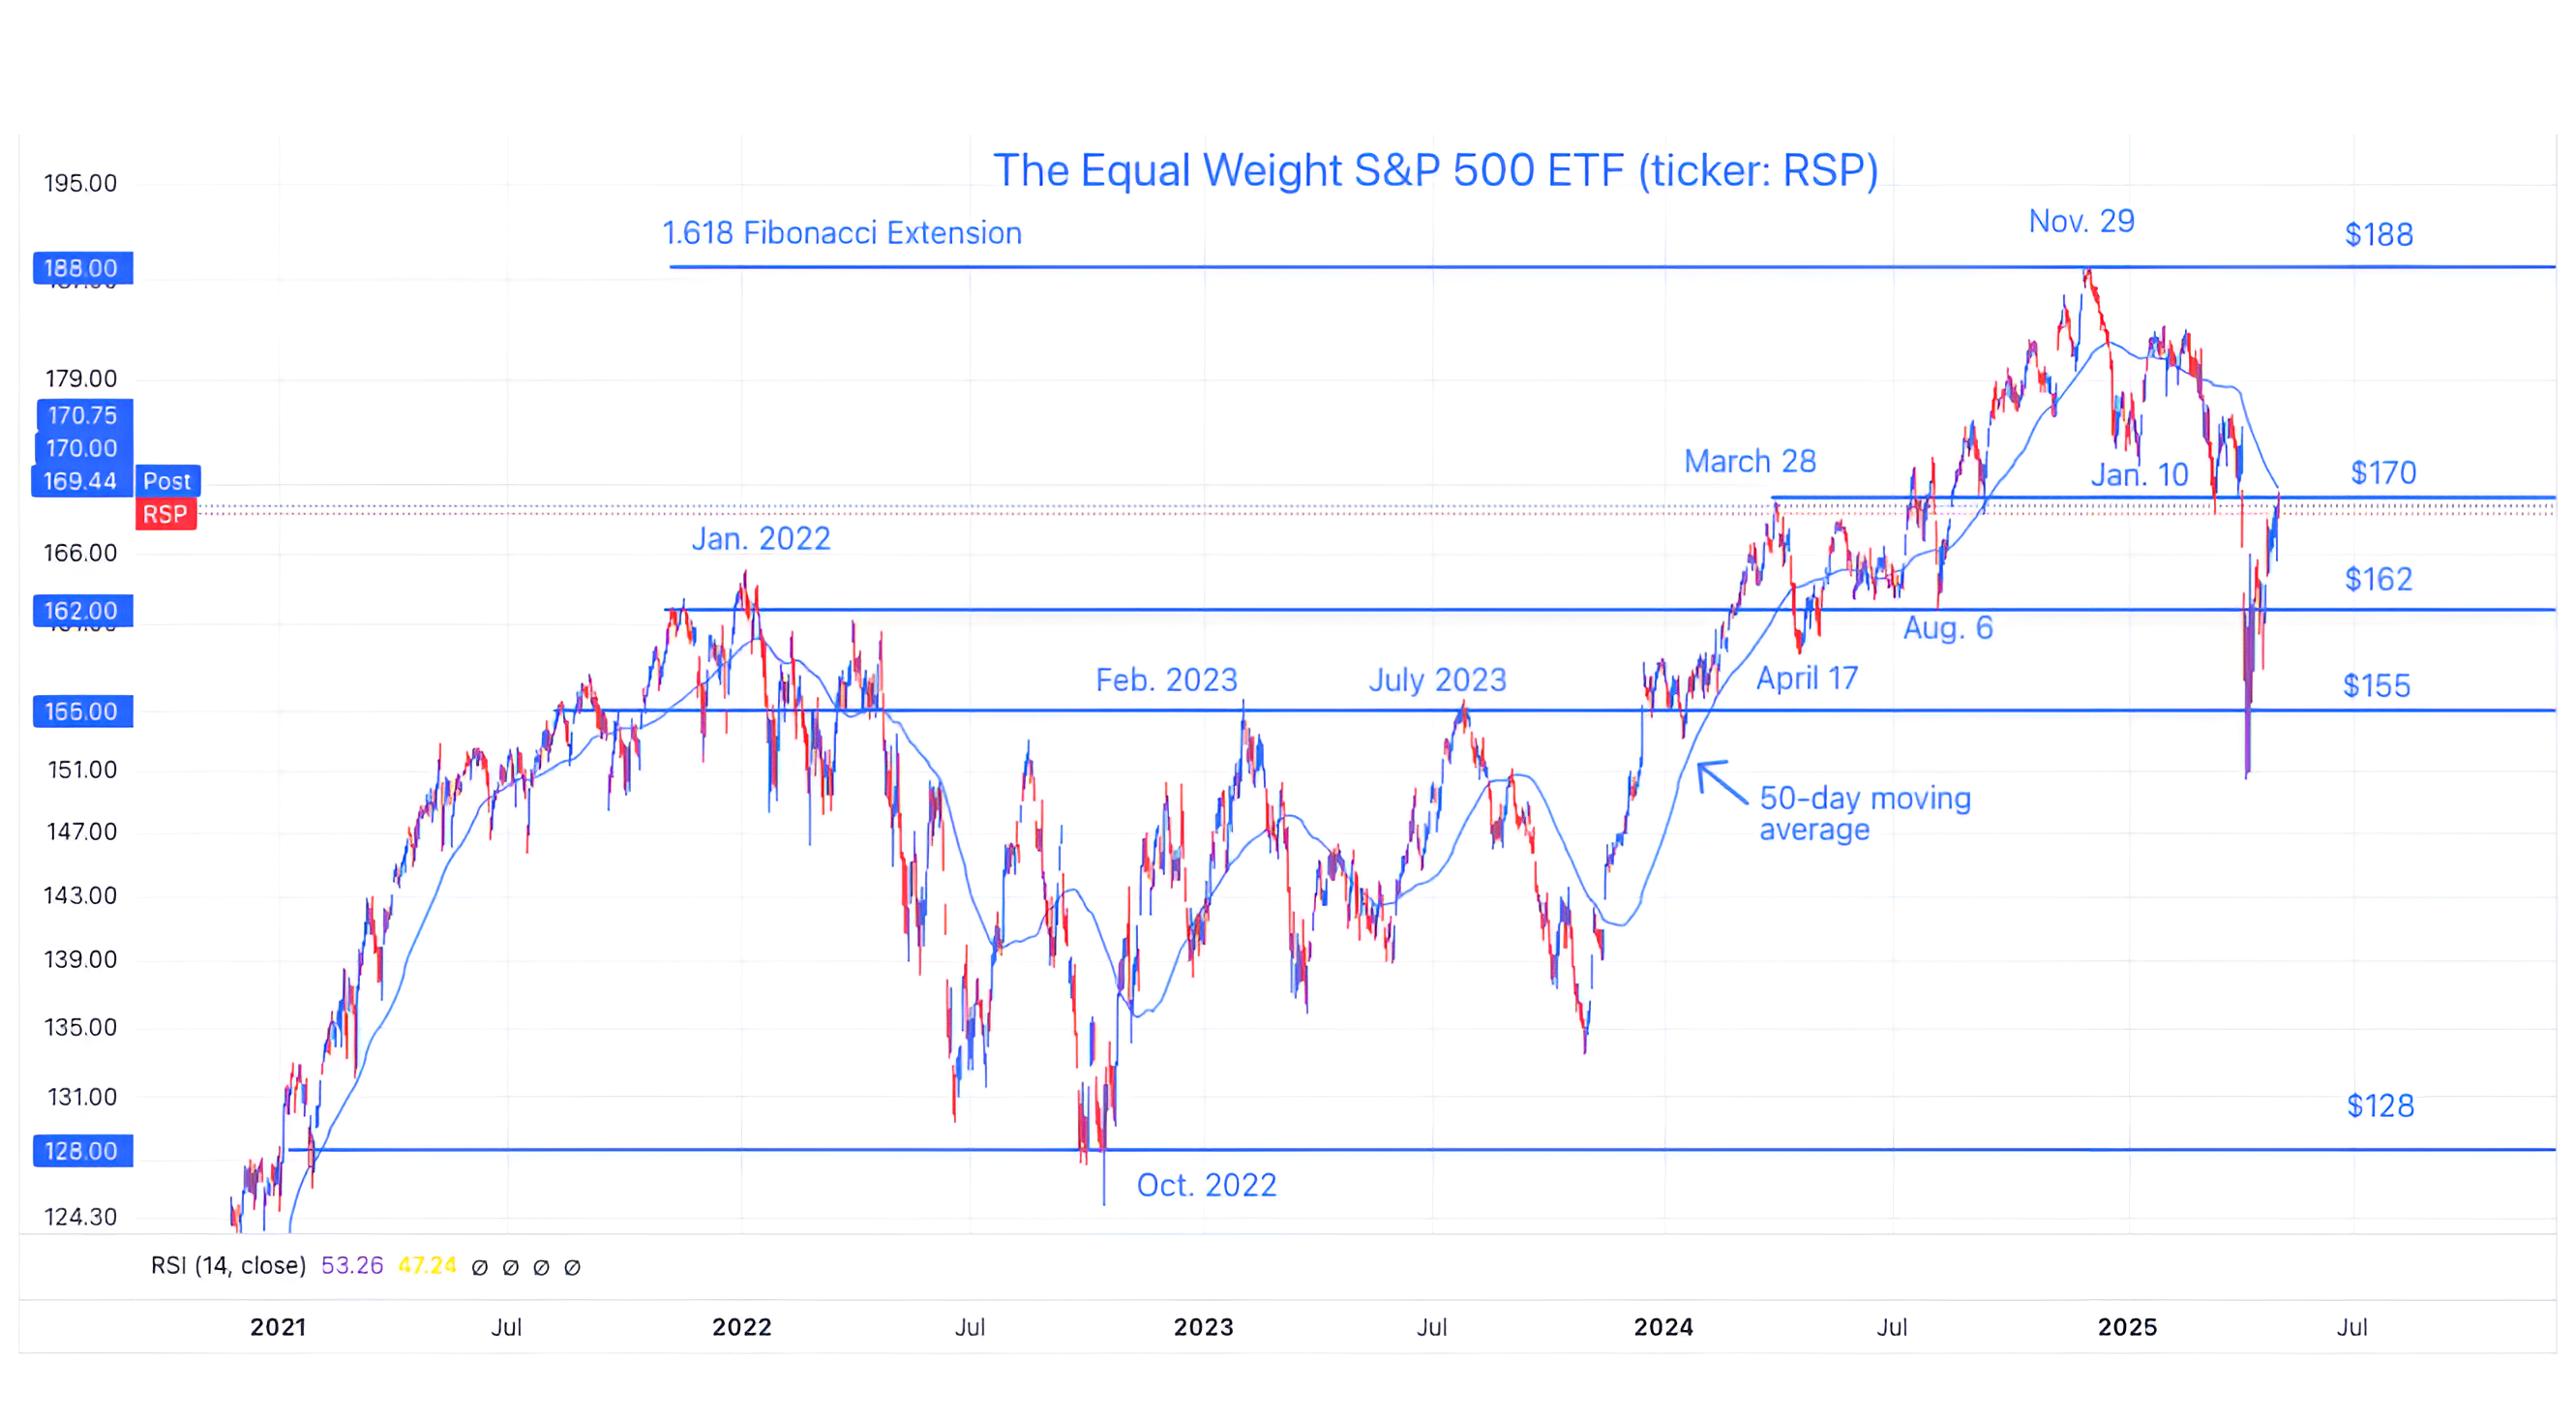
Source: TradingView. Through year-to-date 2025.
The chart above shows the Equal Weight S&P 500 ETF (ticker: RSP).
We always like to check on the Equal Weight S&P 500 as, in our view, it represents the “Average Stock” and doesn’t disproportionately weight the mega-cap Mag 7 shares.
Furthermore, as we’ve noted in the past, as this ETF peaked in mid-December before the S&P 500 and Nasdaq 100 - we should have given greater consideration to the signal.
With that in mind, the Equal Weight S&P 500 ETF has rallied right into the convergence of its March 28 2024 peak - which has acted as both a ceiling and floor over the past 13 months - and its declining 50-day moving average.
We want to see how the ETF responds from here and to see if once again the Average Stock provides an early indication of direction for the main indexes.
(Past performance is not indicative of future results. This is not a recommendation to buy or sell any security and is not investment advice. Please do your own research and due diligence).
4. US Interest Expense on Outstanding Debt. Oh my!
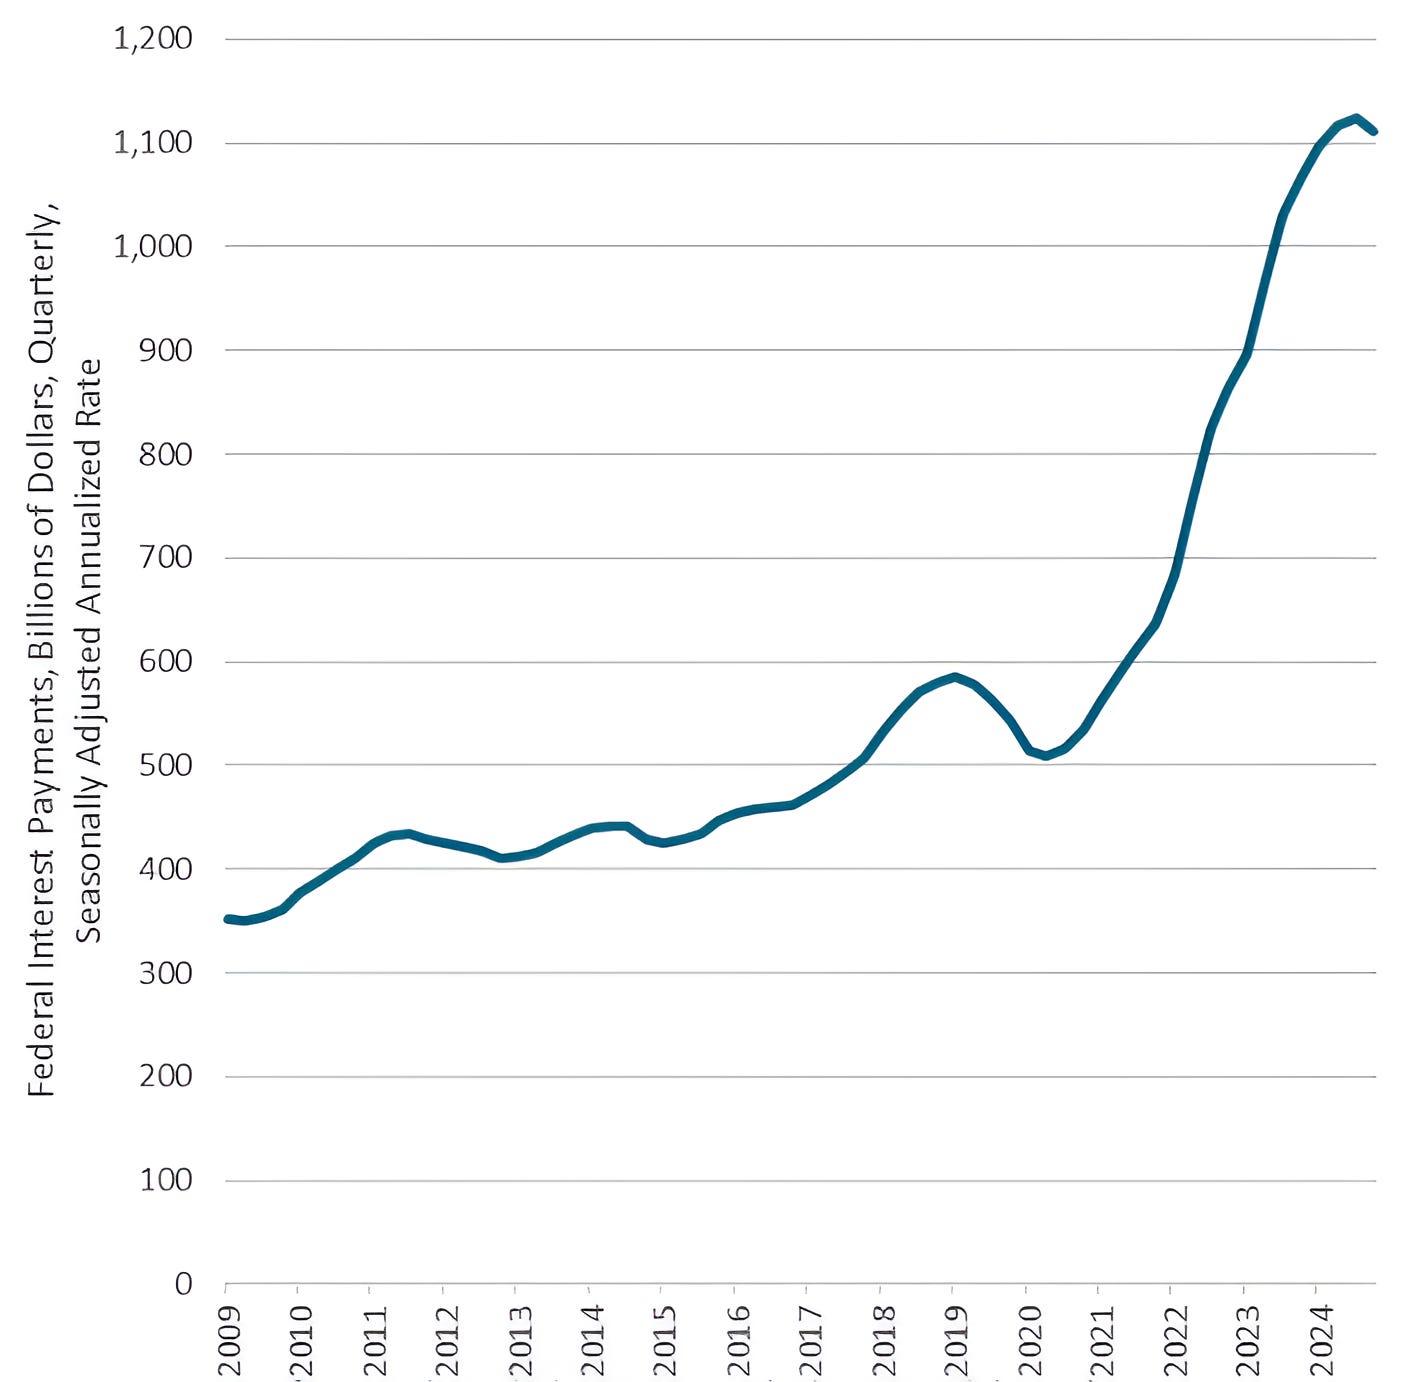
Source: Bureau of Economic Analysis (BEA). Through year-to-date 2025.
The chart above shows the Seasonally Adjusted Annualized Federal Interest Payments on outstanding debt.
I often make the point that after Social Security (retirement benefits) and Medicare and Medicaid (healthcare), interest expense is the third biggest budget line item in the US Federal budget (Chart 3 here).
There are (at least) two notable aspects of this chart:
From 2020, the Interest Expense has more than doubled from $500 billion on an annualized rate to over $1.1 trillion.
Based on the latest data, for the first time since 2020, US Interest Expense on its outstanding debt has moved down.
While interest expense will likely move higher given the fiscal deficit, if Treasury Secretary Bessent can contain this line item, it would be a significant positive.
Along with the news in presented in the introduction that the Treasury may be more active in buying debt and “financing the government at the lowest cost over time,” we see the tick down in interest expense as an under-the-radar positive.
(Past performance is not indicative of further results. This is not a recommendation to buy or sell any security and is not investment advice. Please do your own due diligence).
5. Looking for an Opportunity in Japan…
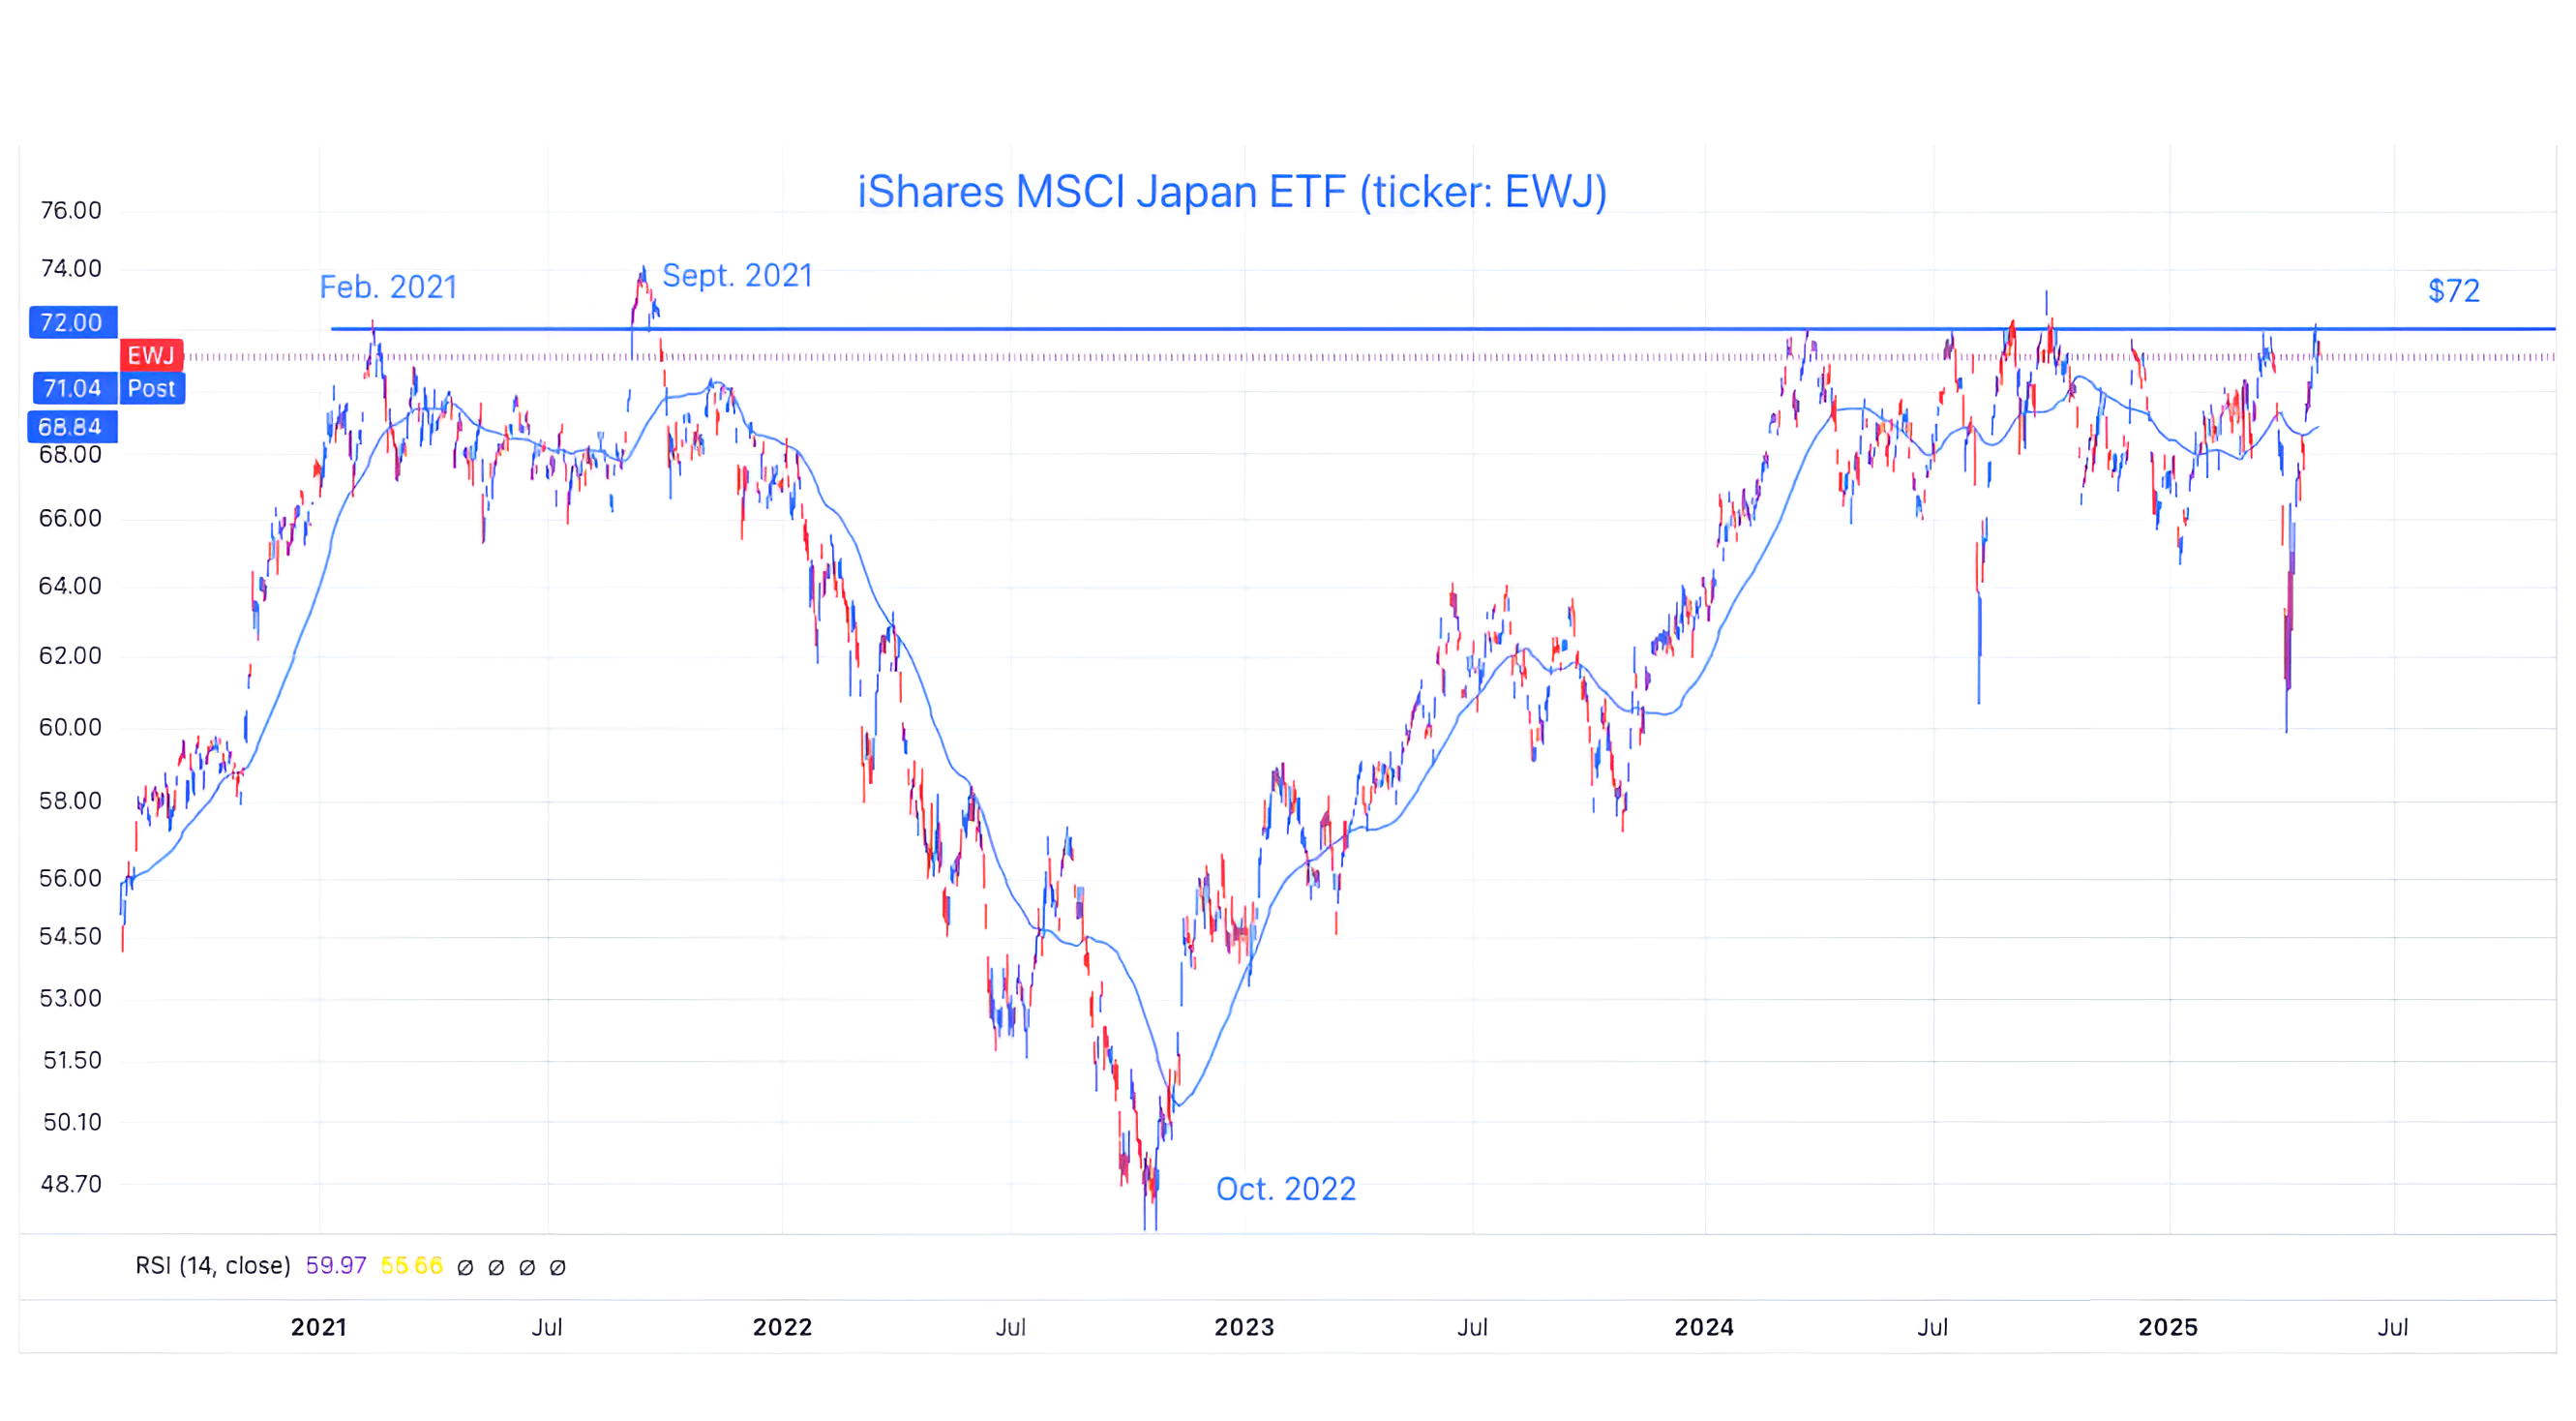
Source: Source: TradingView. Through year-to-date 2025.
The chart above shows the MSCI Japan ETF (ticker: EWJ).
Remember, this ETF (like other non-hedged ETFs) has currency exposure so investors are not only buying Japanese equities, but also Yen.
As we have recently added some European and EM exposure, we wanted to look for a potential opportunity to follow Warren Buffett into Japanese equities (I highlighted the unique structure of the Berkshire investment in Japanese equities in Chart 4 over a year ago, here).
The Japanese Equity ETF is back to its four-year ceiling of $72.
At current levels, we would like to see the ETF move above $72 before adding exposure.
We will be watching.
Have a great weekend!
(Past performance is not indicative of future results. This is not a recommendation to buy or sell any security and is not investment advice. Please do your own research and due diligence).