


Save Your Tears for Another Day
An epic bounce, that's the good news. But the tariff challenge remains and unfortunately, US indexes rallied right into "battlezone" areas with earnings starting tomorrow. Let's dig in...

Let’s start here: we don’t trust yesterday’s rally.
Bear market rallies are a typical feature of volatile periods.
The tariff announcement did not lower aggregate tariffs (see chart 3), it did make the negotiations easier (90-day window) and the process a little better, but that was low bar.
Earnings season starts tomorrow. If earnings expectations are reduced (and even if they aren’t), US equities are trading at a premium multiple that they might not warrant.
Re-tests (revisits to the low) often occur after significant sell-offs.
Nothing good happens under the 200-day moving average - US indexes remain under their respective 200-day moving averages.
That’s the bad news, and it is largely near-term.
The good news:
Large one-day gains have historically been consistent with large gains one-year later (see chart 5).
With a tax cut and monetary easing, we believe the market could “look through” the current noise and focus on 2026 earnings and beyond.
While we expect more downside ahead, over the next 12 month, there is a path to 5700 and potentially 6000.
To summarize: short-term downside, longer-term upside.
Unfortunately, this is a trading market.
Longer-term buy and hold investors with cash should pick downside ranges (we’re focusing on 4800-5000 and 4200-4500 on the S&P 500) to make purchases.
We continue to view this market as guilty until proven innocent.
Within that context, we have once again added to cash in portfolios and are now at 25-30% cash. We have not bought puts or put spreads (which is why we have raised cash above our typical levels) as options are too expensive due to heightened volatility.
(As an aside, I stated three levels for the S&P 500 ETF in chart 1 on Tuesday (here).
The S&P 500 ETF closed exactly at the third level 548 yesterday and at 525, the first level, today.
I point this out simply to reiterate that technical analysis, despite the feeling sometimes that is simply lines on charts, has some significance and validity.)
I made you think that I would always stay
I said some things that I should never say
Yeah, I broke your heart like someone did to mine
And now you won't love me for a second time.
“Save Your Tears for Another Day” — the Weeknd
(Several people have contacted me with questions, further details on policy and allocation suggestions, I am happy to help).

1. Nasdaq 100 ETF: Need to Hold the March 2024 High

Source: TradingView. Through year-to-date 2025.
As has become our Thursday habit, the chart above shows the Nasdaq 100 ETF (ticker: QQQ).
Very simply, the level we are watching is the March 2024 high at 449 (green horizontal line).
If the Nasdaq 100 ETF drops meaningfully below 449, which we believe is likely, a move back to the neighborhood of 405 becomes increasingly probable.
A “re-test” of the lows often occurs in volatile market environments, furthermore, in bear markets, there are often dramatic rallies followed by continued weakness.
While we obviously don’t know the future path or character of the market, in our view, this remains a market that is to be traded and / or treated with caution.
In our view, there is a 60-70% chance that we revisit the November 2021 high (405).
We have increased our cash on yesterday’s rally up to 25-30%.
(This is not a recommendation to buy or sell any security and is not investment advice. Past performance is not indicative of future results. Please do your own research and due diligence).
2. Still Focused on Fundamentals
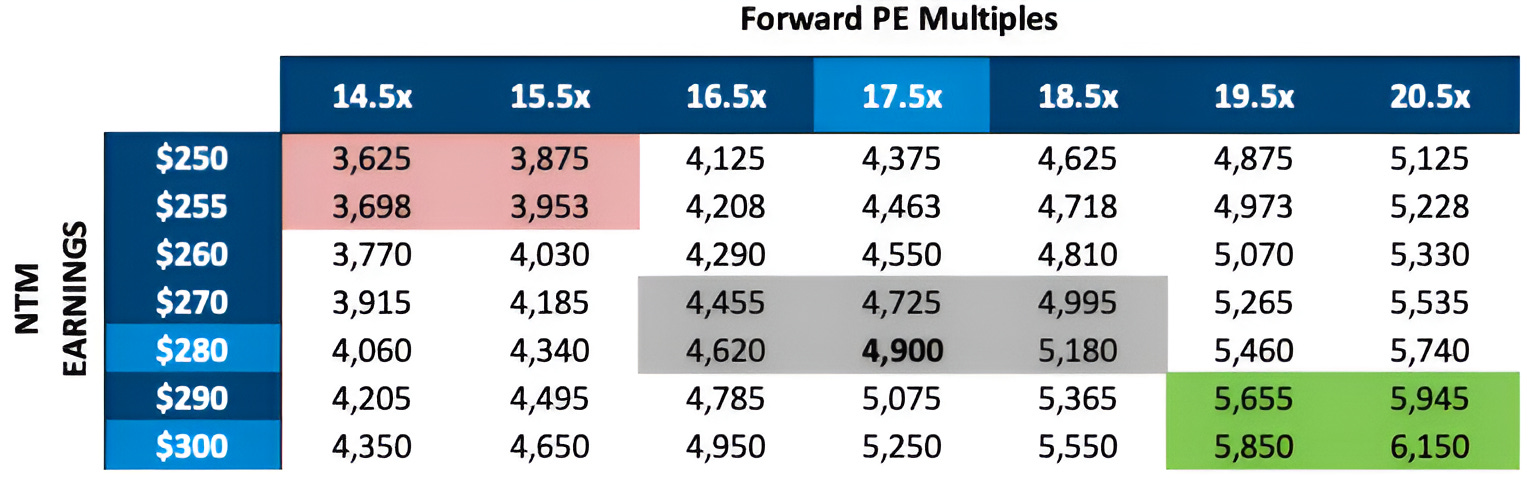
Source: FactSet, Luminos Capital. Through year-to-date 2025.
The chart above shows different scenarios of next 12 months S&P 500 earnings, multiples and the resulting levels.
On Monday, (here), we showed that historical S&P 500 earnings drawdowns during US recessions are around 15%.
Currently, next 12 months earnings are $280 (light blue box) for Q2 2025 through Q1 2026 and 2026 earnings is $308 (our estimate is $300 - the other light blue box).
With earnings season beginning tomorrow, we expect companies to guide earnings lower.
As an example, if earnings are reduced 10% lower for the next 12 months, they would be $250, whereas 10% lower for 2026 earnings would be $280.
The question becomes, what multiple do these earnings deserve?
The S&P 500 ended 2024 trading at 22x expected earnings. This was in the top decile of valuation levels for the past 35 years (see chart 3 here or chart 3 here).
As of today’s close the S&P 500 is trading at 18.8x next 12 months earnings and 17.5x our $300 2026 estimate. In our view, these multiples may be unwarranted given uncertainty and likely earnings reductions.
The trough forward multiple after a sell-off has been around 14.5-15.0x while the average forward PE multiple over the past 35 years has been 16.5x (however, it is rarely average).
We remain focused on 2026 earnings as we are “looking through” the tariff noise with the expectation of an offsetting tax cut and likely monetary easing.
As a result, we still believe there is a possibility for $300 in S&P 500 earnings in 2026 and certainly in 2027.
As we wrote on Tuesday:
“In a world of uncertainty, looking at earnings 18-24 months in advance, we believe a 18-19x multiple could be justified (depending on 10 Year Treasury yields and other factors).
That would lead us to an upside target range of 5400- 5700.”
It is important to note that we don’t expect those levels until some of the “smoke” has cleared and uncertainty is reduced.
In the near-term, we expect the combination of multiple compression due to uncertainty and earnings reductions to drive equity markets lower from today’s levels.
(Past performance is not indicative of future results. This is not a recommendation to buy or sell any security and is not investment advice. Please do your own due diligence).
3. Even After Yesterday’s Tariff Change, There’s a Significant Headwind

Source: Bank Credit Analyst “BCA”. Through year-to-date 2025.
The chart above shows the current aggregate US tariff level along with the likely increases after yesterday’s announcement.
Yesterday’s tariff revision increased tariffs on China and capped tariffs to the rest of the world at 10%.
However, Chinese imports to the US are so disproportionate relative to those from the rest of the world, the actual dollar figure of tariffs likely went up with yesterday’s announcement.
According to Dan Clifton at Strategas:
“The China increase is $275bn higher than what was released last week and offsets the $158bn of tariff reduction announced today.
We also found $100bn of additional exemptions based on the back-up documentation that the Trump Administration released from last week.
Combined, it nets itself out to just a tad bit below $500bn for this year.”
The relief in equity markets yesterday was likely partially attributable to the delay in tariff implementation and the fact that Treasury Secretary Bessent, who is perceived as more market savvy than Commerce Secretary Lutnick or Peter Navarro, made the announcement and may now be in charge of policy.
(Past performance is not indicative of future results. This is not a recommendation to buy or sell any security and is not investment advice. Please do your own research and due diligence).
4. Easing Inflation Gives the Fed Options

Source: Charlie Bilello / Creative Planning. Through year-to-date 2025.
The chart above shows year over year change in Core (ex-food and energy) CPI (Inflation).
Today’s inflation report came in lower than expected with the consumer price index (CPI) gaining 2.4% year-over-year (lower than 2.5% expected) and core CPI adding 2.8% (lower than the 3.0% expected).
In addition, as can be seen from the chart, this is the first time that core CPI has been below 3% in four years.
While this doesn’t take into account the impact of the tariffs (or the noise around them), it would make it easier for the Fed to justify a rate cut.
(Past performance is not indicative of further results. This is not a recommendation to buy or sell any security and is not investment advice. Please do your own due diligence).
5. After Large Gain: 1-Year Return Attractive, Path Uncertain

Source: Strategas. Through year-to-date 2025. Through year-to-date 2025.
The chart above shows the top 25 S&P 500 best single day S&P 500 percentage gains since 1950 and the subsequent index performance over 1-week, 1-month, 3-months, 6-months and 1-year.
Yesterday’s 9.5% move higher in the S&P 500 was the fifth largest daily percentage gain since 1950.
Historically, the 1-year performance of the S&P 500 after the top 15 1-day percentage gains has been positive with the weakest result of 7% in 1987.
When we expand the aperture to the top 25 1-day gains, there have been two instances the S&P 500 has been negative one year later.
On average the 1-year performance after a large daily gain has been robust.
However, the performance in the intermediate time frames has been much more volatile.
This is consistent with our view of a continued challenging path with a positive resolution.
(Past performance is not indicative of future results. This is not a recommendation to buy or sell any security and is not investment advice. Please do your own research and due diligence).