


Aint Nuthin but a "G" Thang, Baby...
With the S&P 500 and Nasdaq 100 both fighting with their respective 200-day moving averages, it's all about economic and earnings "G"rowth from here! Let's dig in...

In each of the past two years, US equities delivered 20% plus returns.
While S&P 500 earnings grew 10% in 2023 (after 1% growth in 2022) and 11% in 2024, the Index appreciated 58% over that period.
The difference, of course, was multiple expansion, which often captures investors expectations of future earnings growth.
By the end of 2024, the valuation of the S&P 500 had hit over 22x expected earnings, a level that is in the top decile of the past 30 years. (See chart 3 here).
Although valuation is not a catalyst, 22x earnings, in our view, is (and was) a constraint to further upside.
Continued multiple expansion from those levels was likely limited and equity market appreciation, would need to be driven by earnings growth.
Additionally, it is possible that any significant earnings growth slowdown could be met with valuation multiple contraction - essentially a compounding effect.
As we showed on Tuesday, 2025 earnings have remained fairly stable. However, when earnings season begins in two weeks, we wouldn’t be surprised if management teams guide their outlooks lower.
As our view has been that a combination of stealth monetary stimulus, fiscal spending and hyper-scaler capex (see chart 4, here) drove markets higher (we highlighted these factors in the introduction here) over the last 18 months, it is possible that the slowdown and removal of these will lead to continued equity market volatility.
With the indexes, particularly the Nasdaq 100, below its 200-day moving average (see chart 1, below), we have trimmed some of the higher growth exposure within our equity portfolios.
We have maintained the more value-oriented dividend shares, energy names, gold miners and non-US equities that we recently added to portfolios. We remain hedged.
While we are not making a recession call, in our view, questions about slowing economic and earnings “G”rowth may lead to equity volatility and limit near-term upside.
Aint Nuthing but a “G” Thang, Baby.

1. The Nasdaq 100: Rejected at the 200-Day Moving Average
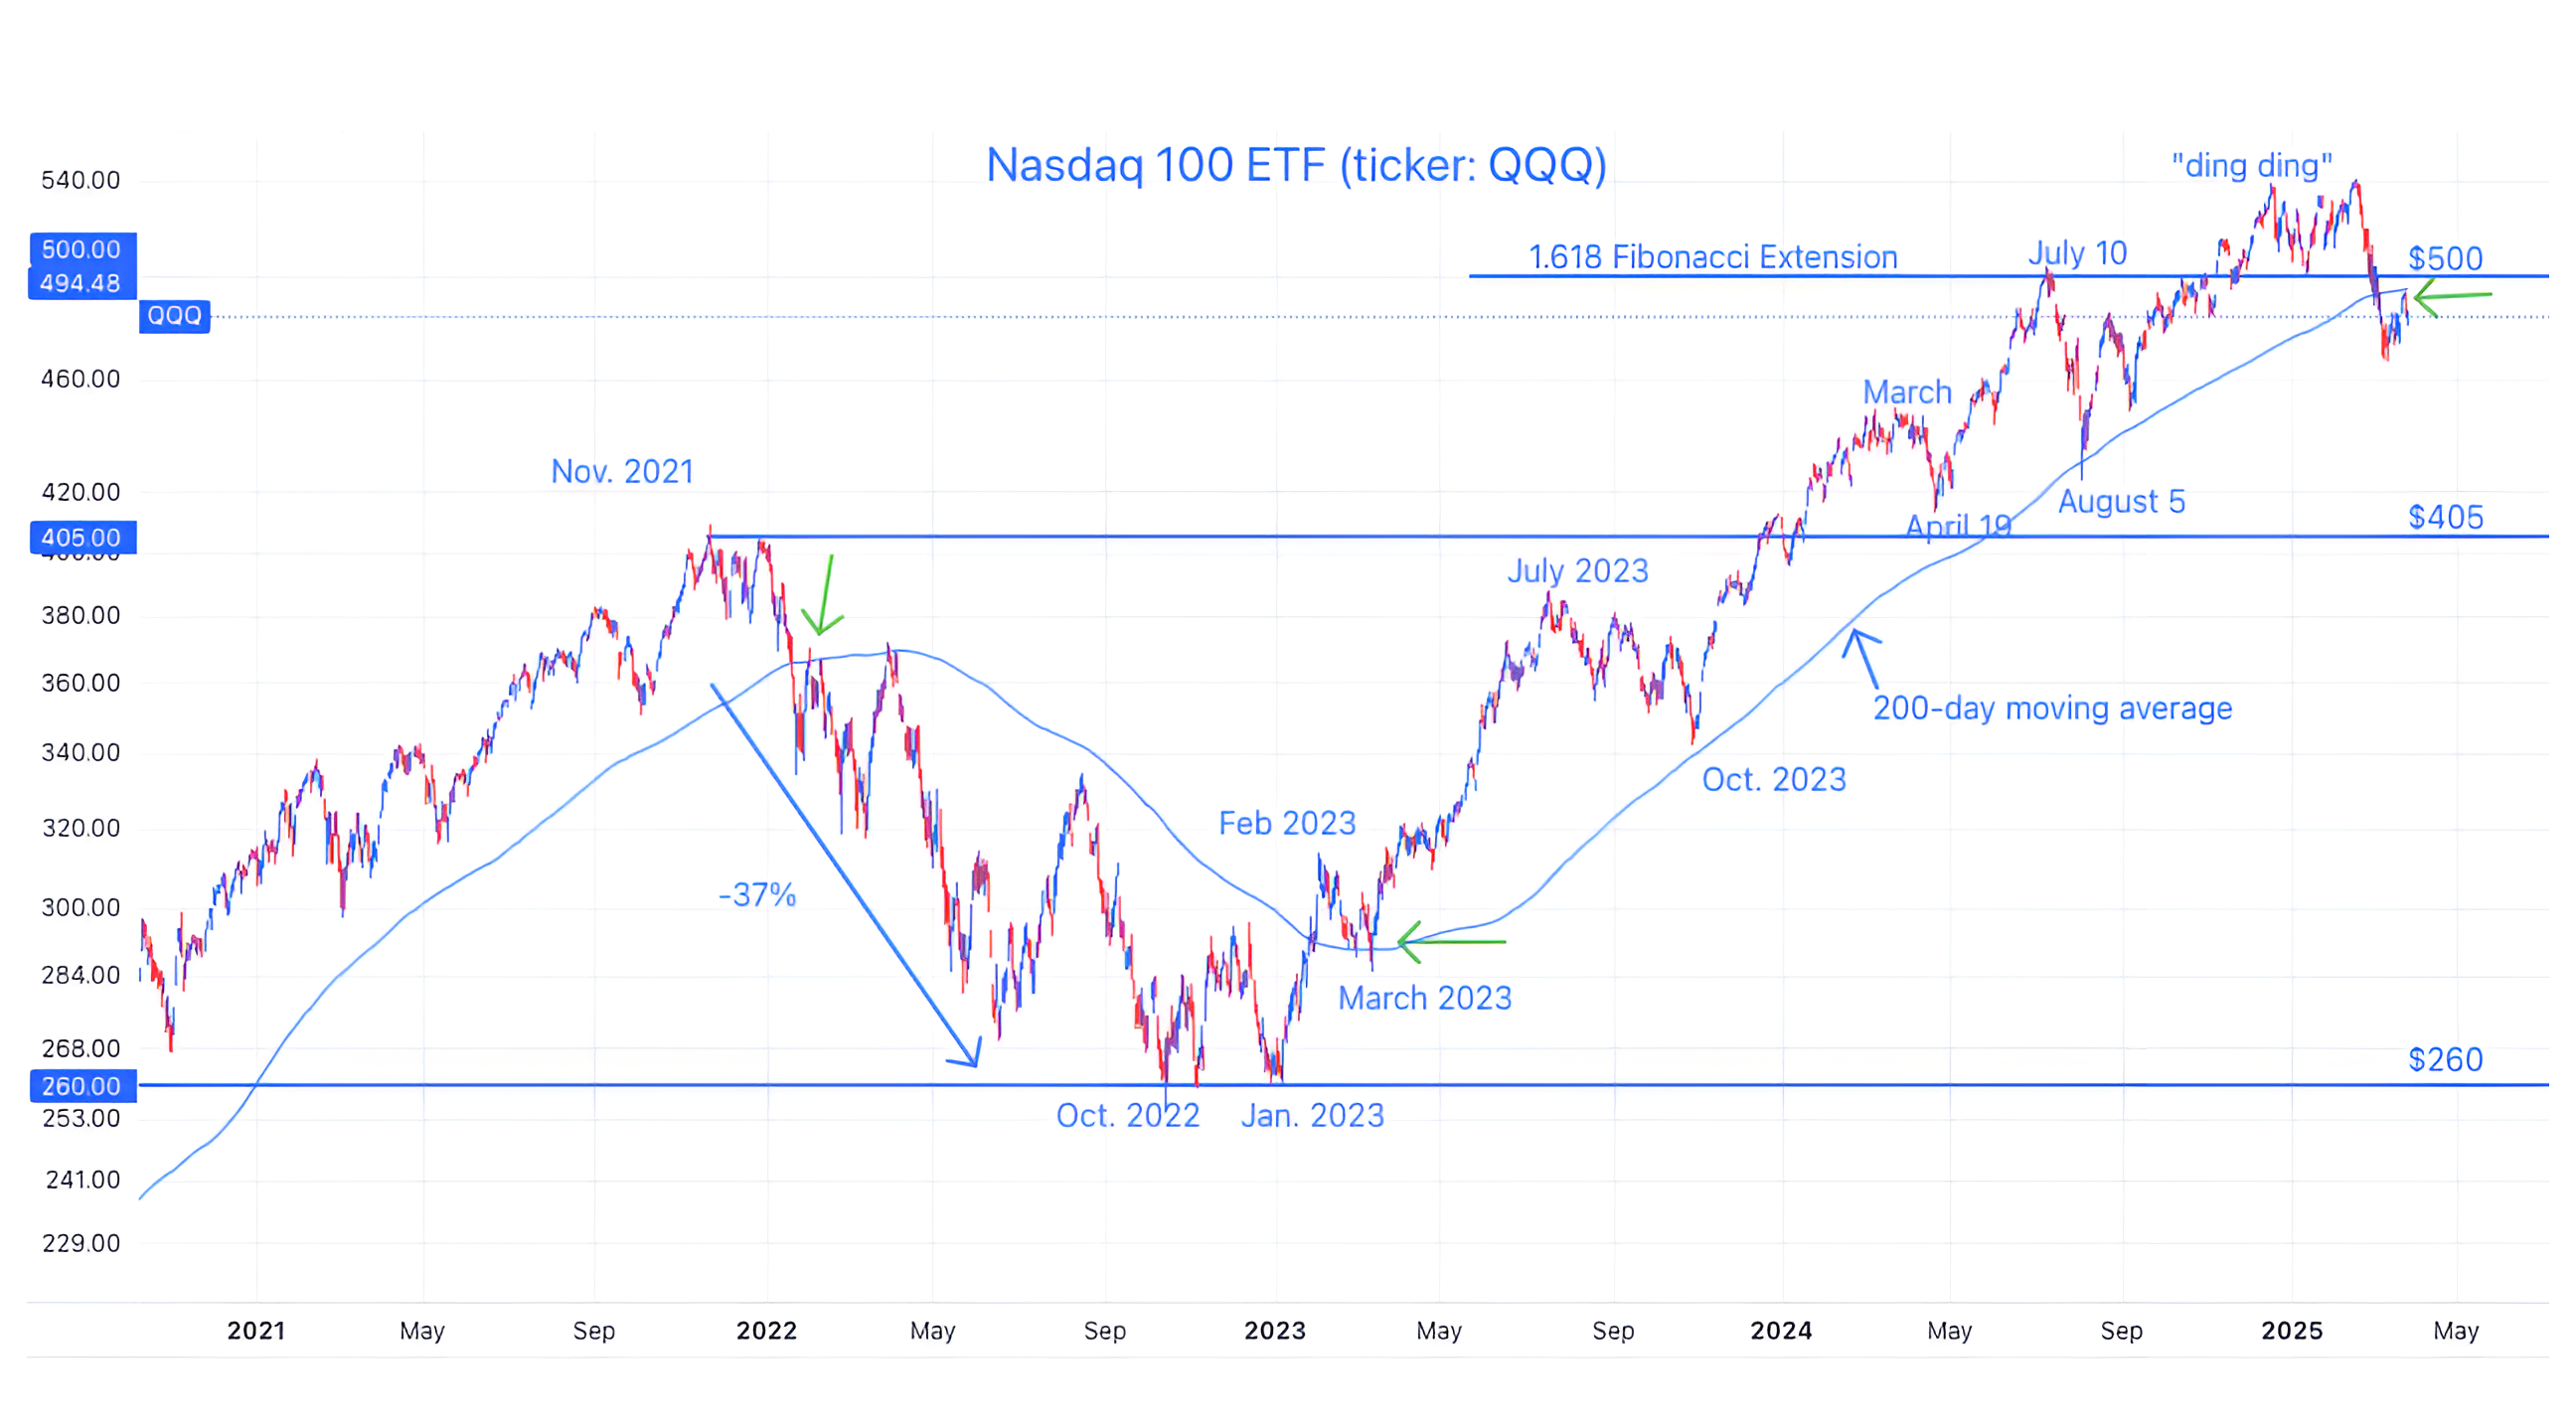
Source: TradingView. Through year-to-date 2025.
The chart above shows the Nasdaq 100 ETF (ticker: QQQ) with its 200-day moving average (curved light blue line).
When we showed this chart last week (here) we characterized the Nasdaq 100 ETF as guilty until proven.
We have wanted to see what would happen when the Nasdaq 100 rallied back to its 200-day moving average:
Would it be like 2022, when it failed (left green arrow)?
Or would it be similar to 2023 when it moved straight through before revisiting from the north (middle green arrow)?
This week the Nasdaq 100 moved up with its 200-day moving average (far right green arrow) as we expected it would, and has (at least for the time being) turned back down.
While this is not definitive, it does warrant further caution.
As we have been saying, nothing good happens under the 200-day moving average (as it turns out this saying is attributed to Paul Tudor Jones, a well know macro trader, not my mother).
We continue to believe this market is guilty until proven innocent and have trimmed some of our Nasdaq 100 / large cap growth exposure from our equity portfolios.
(This is not a recommendation to buy or sell any security and is not investment advice. Past performance is not indicative of future results. Please do your own research and due diligence).
2. A Slowdown in Semis…
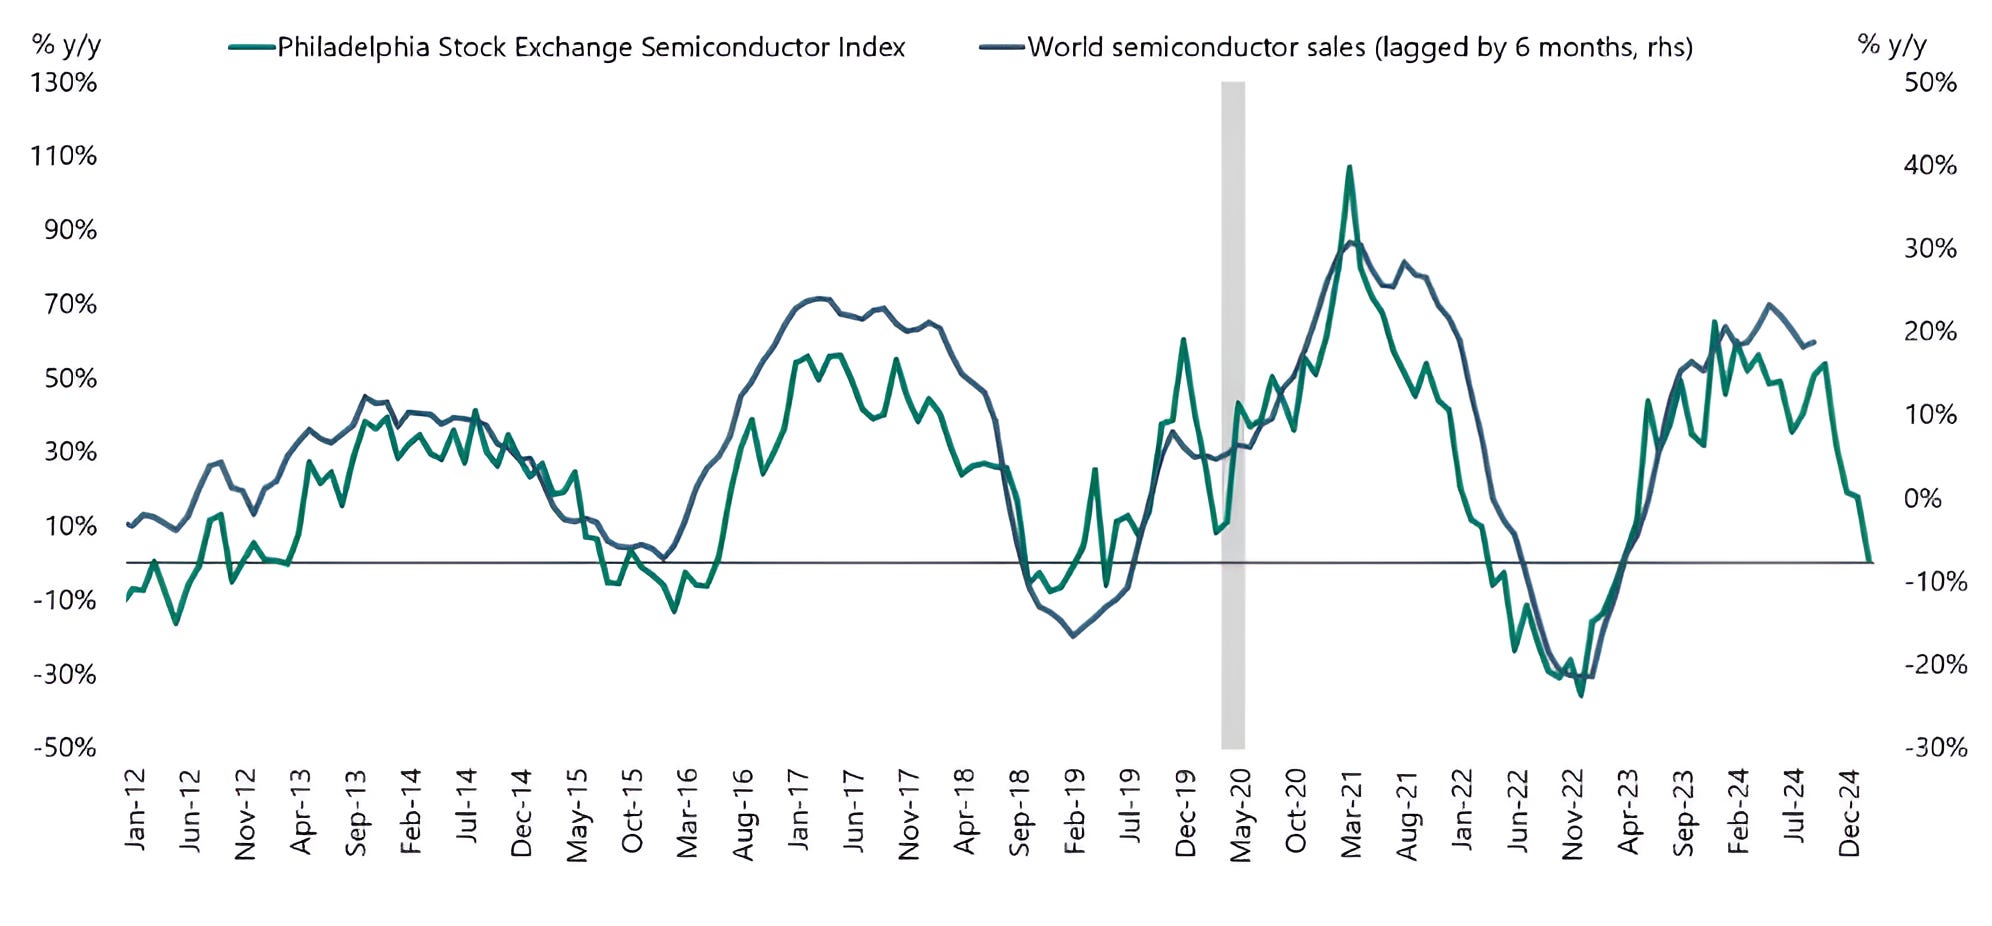
Source: Apollo Chief Economist / Torsten Slok. Through year-to-date 2025.
The chart above shows the year-over-year change in the Philadelphia Semiconductor (stock) Index (green line) and the year-over-year change in World Semiconductor Sales (lagged by 6 months) (grey line).
(We showed the Semiconductors chart a month ago (chart 3 here) and it hasn’t improved since).
As the chart above shows, historically, a pullback in the Semiconductor Index has foreshadowed a slowdown in semiconductor sales.
This week, the Chairman of Alibaba, Joe Tsai, warned of a potential bubble in artificial-intelligence spending and data-center construction.
In addition, Microsoft said it has stopped some data center projects in the U.S. and Europe due to lower-than-expected demand.
At the end of January (here) around the time of the DeepSeek announcement, we wrote:
“If data center capex were to slow or decline, this could lead to significant changes in earnings guidance from many of the companies that led markets higher in 2024 and potentially result in overall equity market volatility.”
(This whole note is worth re-reading).
In our view, the slowdown in data center construction could have a much larger impact than only on semiconductor sales.
As hyper scaler investment (see chart 4 here) slows or disappoints, it will impact energy and other infrastructure investments.
Essentially, we see the possibility of a broader economic effect as semiconductor and data center spending slows.
(Past performance is not indicative of future results. This is not a recommendation to buy or sell any security and is not investment advice. Please do your own due diligence).
3. Watching the Transportation Index

Source: TradingView. Through year-to-date 2025.
The chart above shows the Transportation Index.
We showed this at the beginning of February (chart 2 here).
When we want to understand the equity market’s interpretation of the economy we often look to the Transportation Index and Russell 2000 Small Caps.
While both charts are well below their respective highs, we’re showing the Transportation Index because it is sitting at what we believe is a significant level. (This line was included the last time we showed the chart - we didn’t add it here).
At the beginning of February (the last time we showed the chart), the Transportation Index had fallen back below its ceiling level (top solid blue line), but hadn’t exhibited any significant weakness.
Now, two things are evident:
The peak in the Transportation Index in November 2024 - which occurred before the December 18 or February 19 double top in the Nasdaq 100 - was a signal we should have respected;
We need to see how the transports react at their four year “mid-line.” A rejection at this level may be an indication of further economic weakness.
(Past performance is not indicative of future results. This is not a recommendation to buy or sell any security and is not investment advice. Please do your own research and due diligence).
4. Economic Survey Data Looks Worse than Actual Data
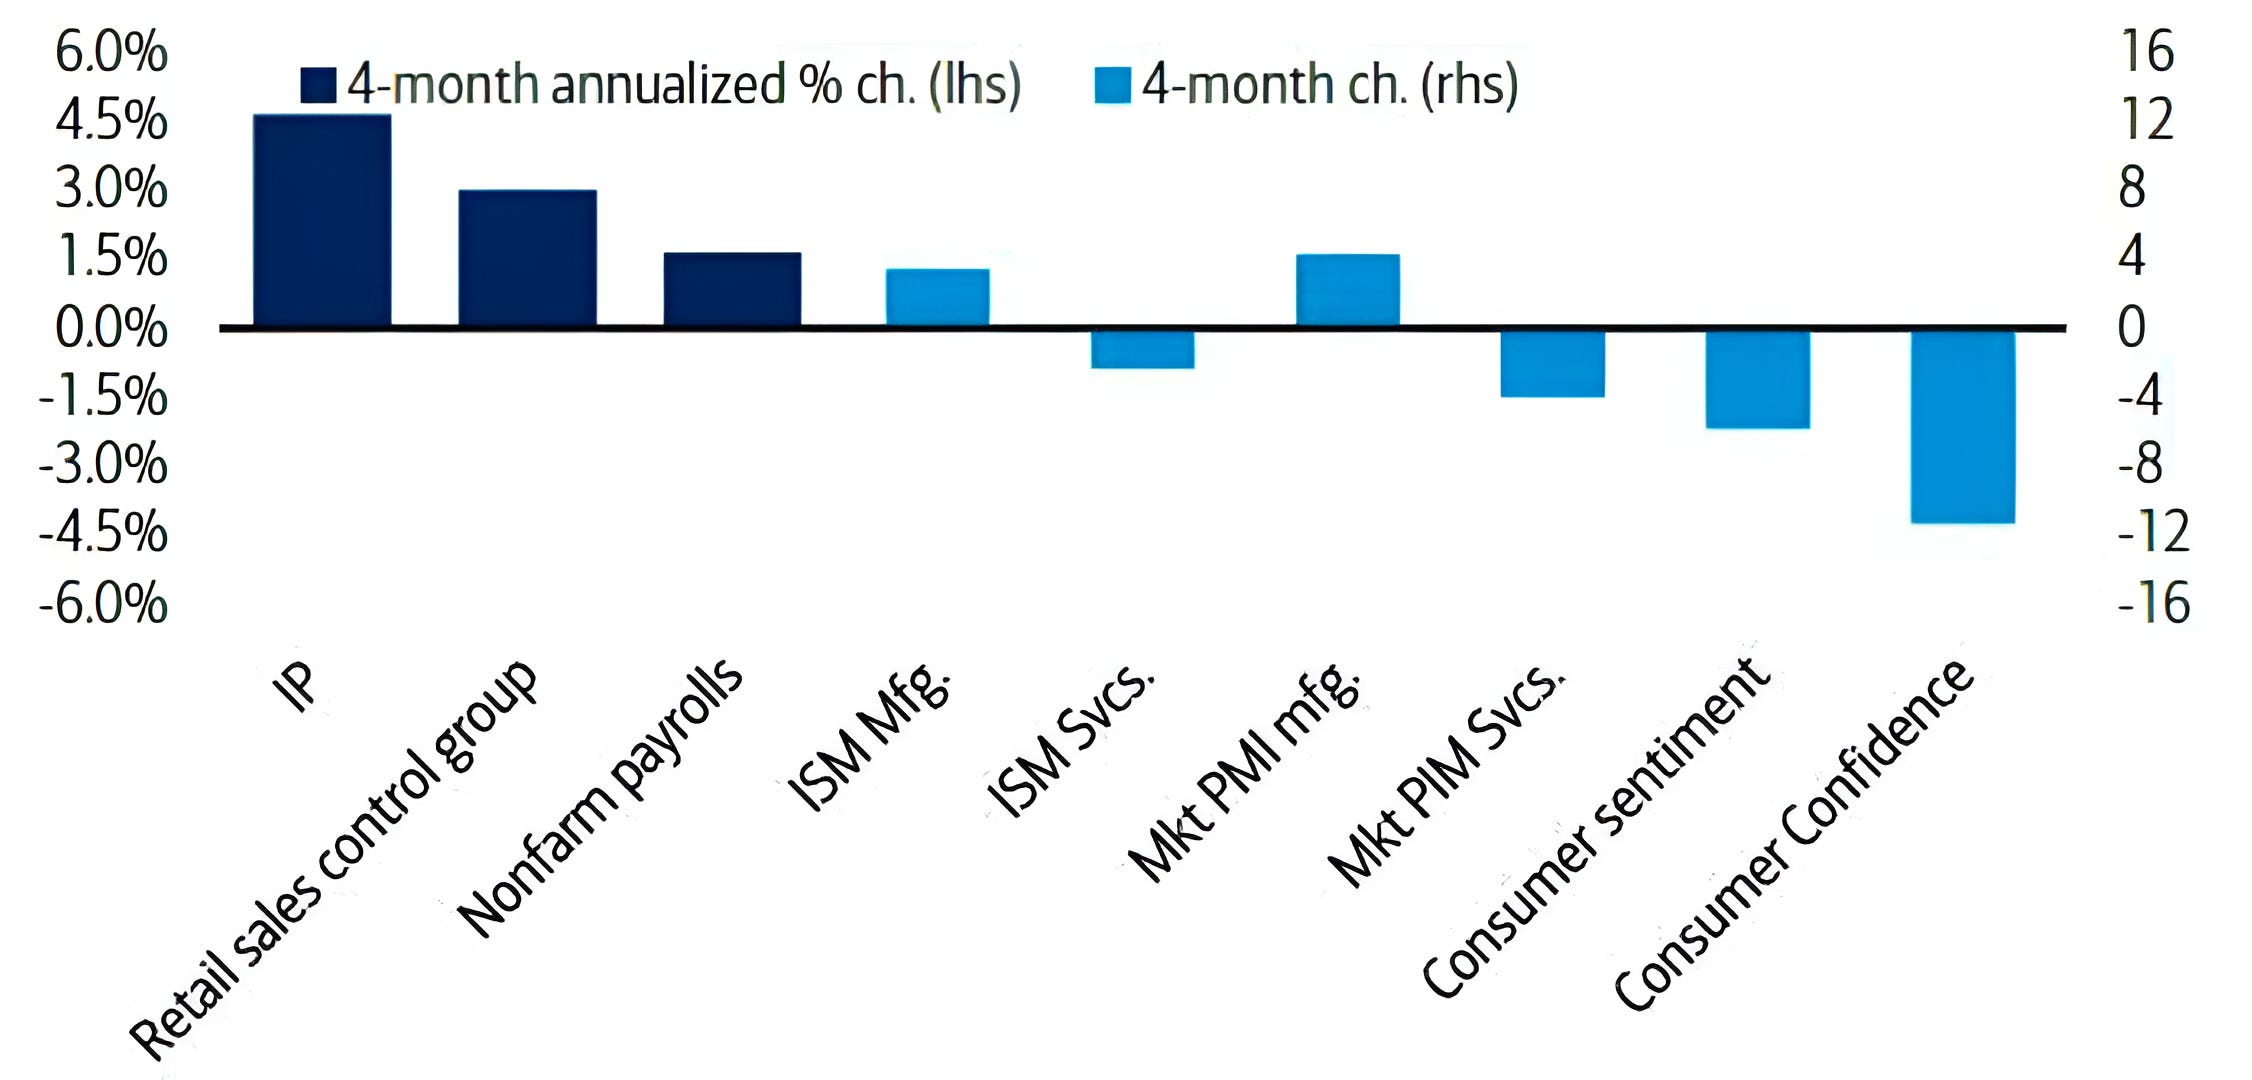
Source: Bank of America, U. Michigan, Conference Board, ISM and Haver Analytics . Through year-to-date 2025.
The chart above shows a range of Actual Economic Data (left side, dark blue) and Survey Data (right side, light blue).
Very simply, the survey data looks worse than the actual data.
Will the negative sentiment reflected in the surveys transcend into the real economy?
We believe it will, however, it is difficult to say that to what extent.
In other words, some softness at the margin may not lead to a recession, but may simply reflect slowing growth.
The key indicator, in our view, is employment.
We will be watching the weekly jobless claims data (continue to be steady, not reflecting any stress) as well as the details of next Friday’s employment report.
(Past performance is not indicative of further results. This is not a recommendation to buy or sell any security and is not investment advice. Please do your own due diligence).
5. Is Caution Warranted or Is it a Buy Signal?

Source: Carson Investment Research / Ryan Detrick. Through year-to-date 2025.
The chart above shows the S&P 500 and the times that the American Association of Individual Investors (AAII) Investor Survey has show 50%+ Bears for five straight weeks.
The current period is only the third time in the last 35 years that bearish sentiment has been over 50% for five consecutive weeks.
Obviously, a sample size of two is not statistically significant but the other two times with this consistent level of bearish sentiment were buying opportunities.
The average 1-month return of the prior two times when bearish sentiment became this extreme was 7% and the average six month return was 20%.
We will see if the caution in the current period is warranted or a buying opportunity.
(Past performance is not indicative of future results. This is not a recommendation to buy or sell any security and is not investment advice. Please do your own research and due diligence).