


I Think I'm Turning Japanese
From Japanese candlestick (technical) patterns to the Yen, Japan influences are being felt across global markets. Let's dig in...
Let’s start today by considering the ultimate carry trade: borrow in Yen; sell (short) Yen and buy $; use $ to buy US Tech shares.
As a reminder, the foundation of the carry trade has been the Bank of Japan (BOJ).
The Bank of Japan has implemented the most aggressive monetary stimulus of any developed central bank over the past 15 years. It has kept short term rates negative with no hikes since 2007 and has kept long-term yields below 1% through Yield Curve Control (essentially QE infinity).
While borrowing costs in Japan have remained low and the Yen lost value relative to the US dollar (chart 5), the carry trade was easy.
We highlighted that Warren Buffett had implemented his own version of this trade (chart 4 here) without the currency risk by borrowing in Yen and buying Japanese shares.
What happens when the Bank of Japan becomes less lose and the “carry trade” unwinds?
Over the weekend, the likelihood that the Bank of Japan would lift its benchmark interest rate above 0% at its March 18-19 meeting gained traction. In addition, there is speculation that the BOJ could end or at least soften its Yield Curve Control.
Has liquidity from the Bank of Japan along with the Stealth Liquidity from the US Fed and Treasury been propping up the Everything Rally?
What happens with an unwind?
In addition to policy measures, we have been viewing US markets through the lens of candlestick charts (the ones we always show).
While candlestick charts and pattern recognition began in Japanese rice trading the 1700s (history here), on Friday, some notable formations occurred in US markets (charts 1 and 2).
1. Indecision After Historic 18-Week Move
After 16 of 18 weeks higher (the blue candles on the chart below indicate higher and the red indicate lower) that led to 25% appreciation in the S&P 500, the weekly chart of the S&P 500 formed “doji” pattern last week.
The “doji” pattern has an open and close that are virtually equal and derives its name from the Japanese phrase meaning the “same thing.”
The candlestick often looks like a cross (if you look closely at the red candle closest to the right, you can see it).
From a market perspective, a doji can be a sign of indecision and many times has marked turning points in price direction.
As we often write, before drawing any conclusion, we need to look for confirmation, not only in the chart itself, but “below the surface” (new highs and lows, percent above moving averages etc.) and in inter-market relationships.
We will continue to evaluate if the doji represents an oncoming correction or simply a pause before additional appreciation.
(This is not a recommendation to buy or sell any security, it is not investment advice).
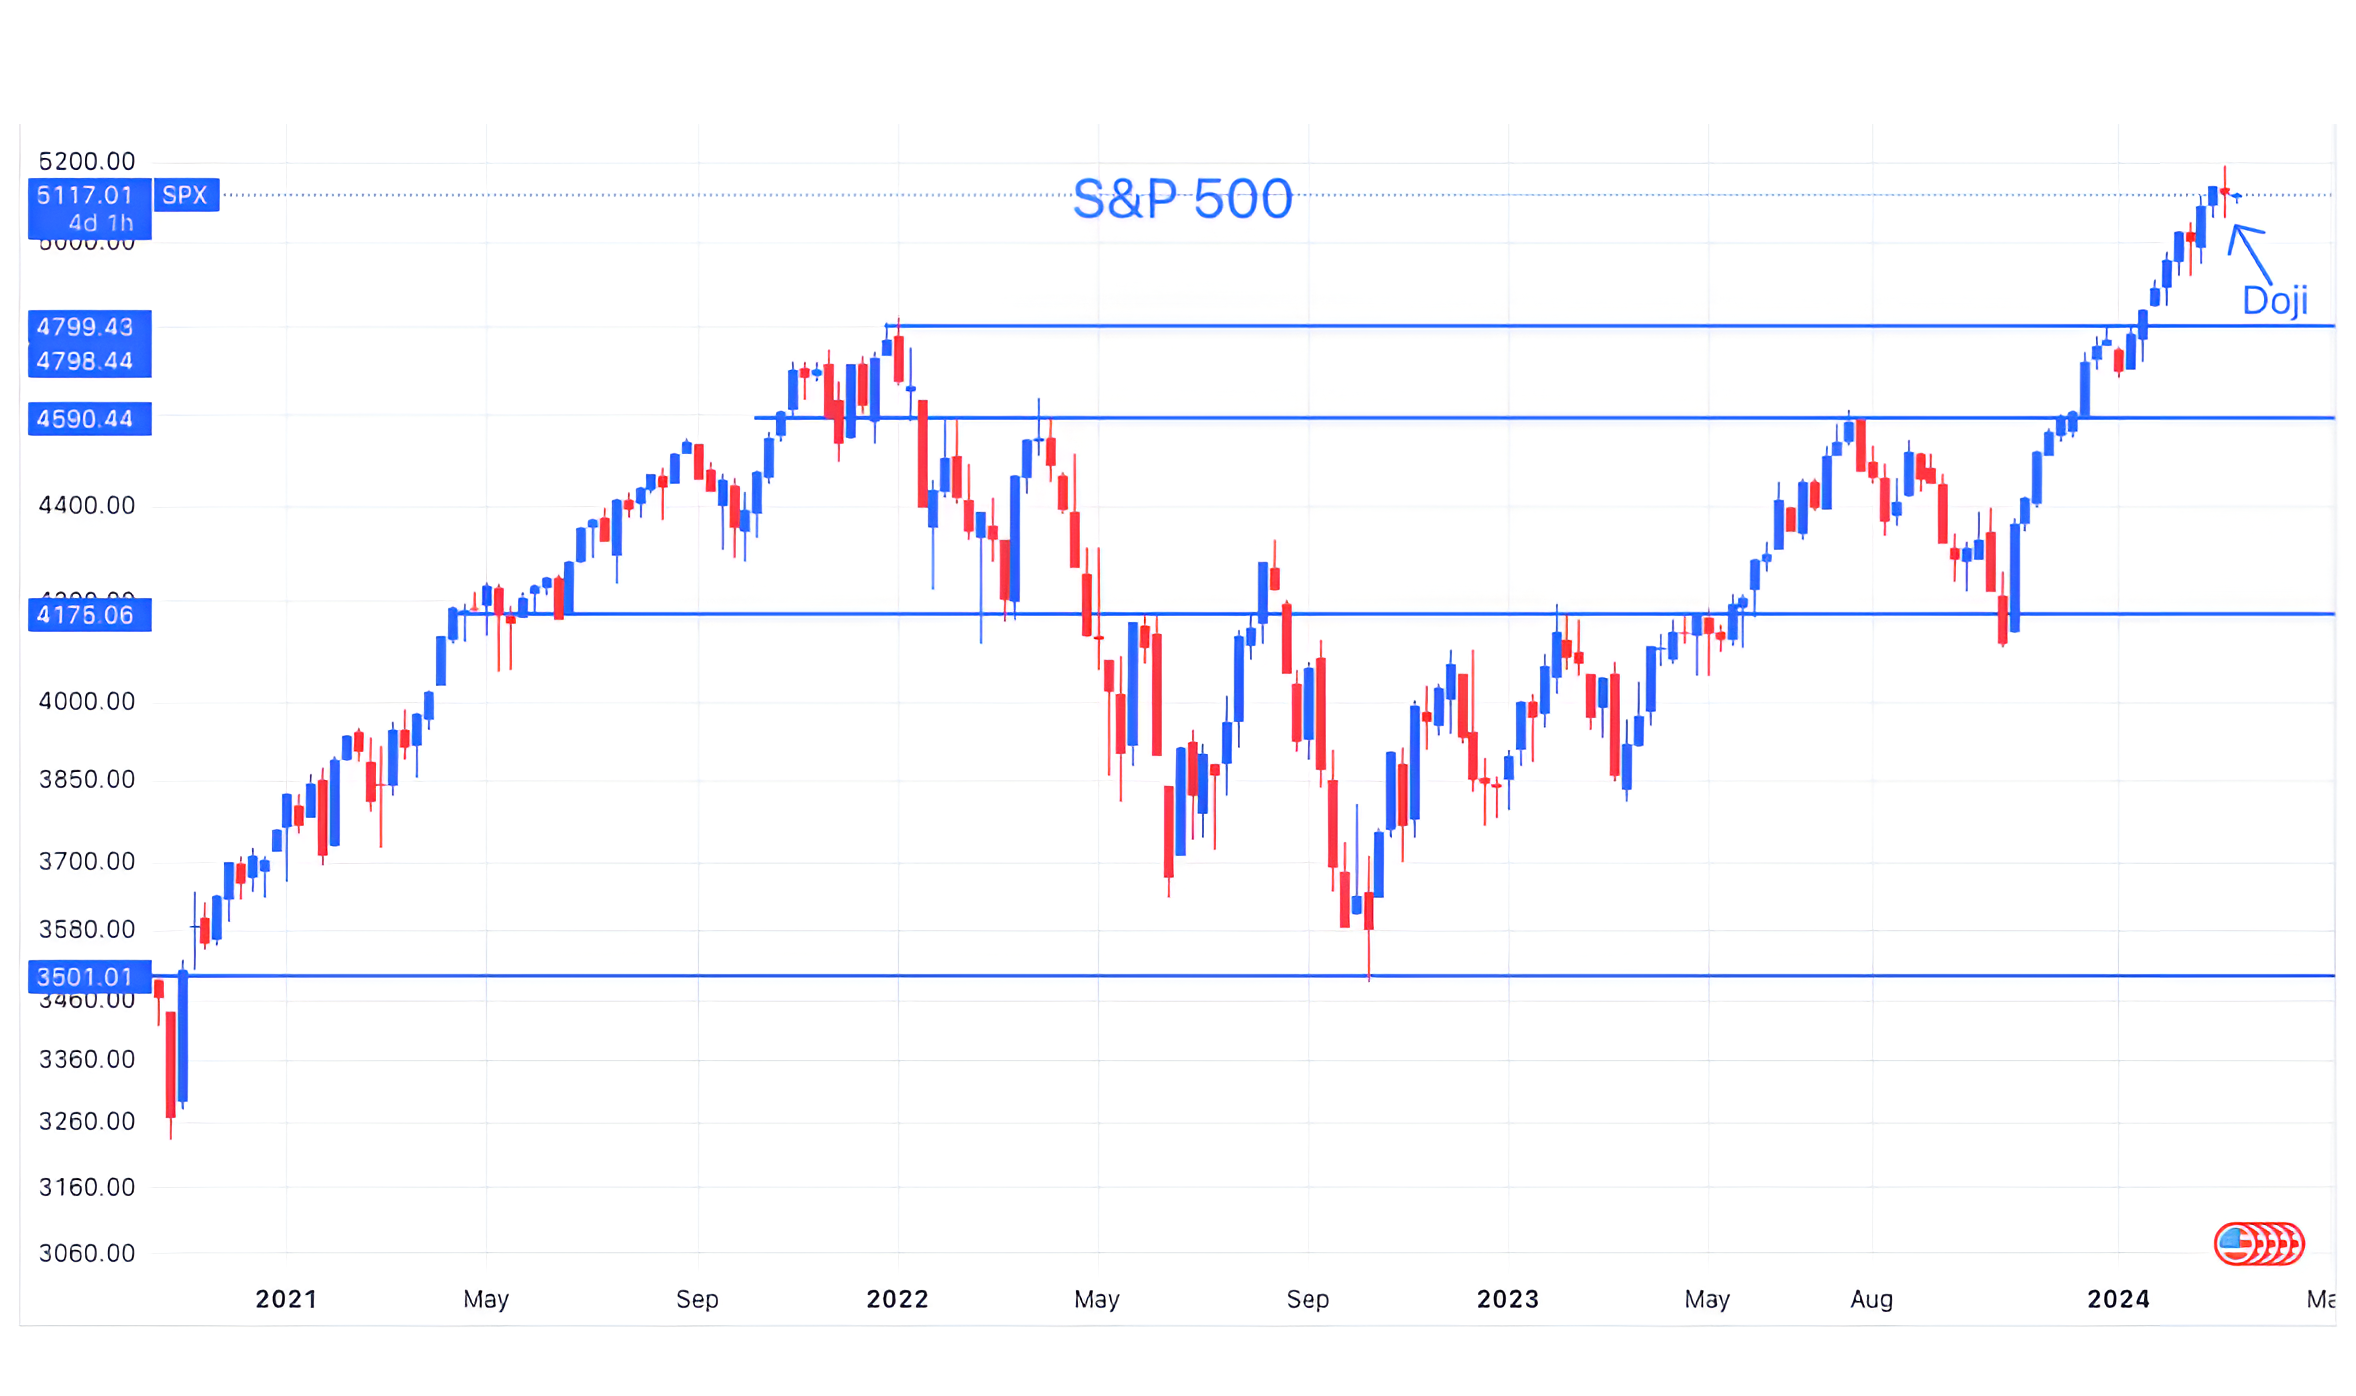
Source: TradingView. Through year-to-date 2024.
2. Nvidia “Outside Reversal Day”
Last Thursday, we highlighted our belief that the Semiconductor Sector ETF (ticker: SMH) would likely pause and contend with its “symmetric” upside from its December 2021 to October 2022 sell-off (chart 3 here). (This is not a recommendation to buy or sell any security).
Right on cue, the largest component of the Semiconductor Sector ETF, on Friday, Nvidia (chart below) had a massive reversal. (This is not a recommendation to buy or sell any security).
How do we define massive?
At 10:30 AM ET, Nvidia peaked near $974/share. By 1:35 PM ET, it was trading at $865 reflecting an 11.2% intraday drop and a loss of $260b in market cap.
This was likely the largest intra-day market cap reversal in a single share in the US ever.
After Nvidia’s earnings, we wrote:
“The report has allowed analysts to project at least $30 in earnings per share for fiscal year 2025 (calendar year 2024) and many can apply a 30x multiple to one of the fastest growing mega companies ever to come to a price target of $900.”
We find it notable that Friday’s trading oscillated around the $900 level that we cited.
From a Japanese candlestick technical perspective, Friday was an “outside reversal day.”
This means that the high of the day was higher than the high of the prior day, while the low and the close were lower than the low of the prior day.
This Japanese candlestick pattern has often preceded further weakness. (Past performance is not indicative of future results).
While we don’t know if Nvidia shares will sell-off from current levels, we have drawn in potential levels on the chart that were meaningful on the shares ascent. We will watch to see if any of these are broken.
(This is not a recommendation to buy or sell any security and is not investment advice).

Source: TradingView. Through March 5, 2024.
3. Another 1998-2000 Rhyme
Last Tuesday, we wrote that there were characteristics of the current rally that are reminiscent of (or rhymed with) the 1998-2000 period (here).
Maybe due to confirmation bias, we found the chart below interesting.
Over the last 30 years, the only other time that has resembled the past year in terms of the percent of S&P 500 members outperforming the S&P 500 was in 1999.
We want to reiterate that we do not see the current period as a bubble.
Rather, we view the chart below as an indication of the possibility that this year will be very different from last year within US equity markets.
Whereas last years rally that was narrow and characterized by the strength of the Magnificent 7, one of our themes (or at least considerations) this year has been the possibility that the Magnificent 7 underperform while a broader number of other shares outperform.
(This is not a recommendation to buy or sell any security).

Source: CharlieBilello. Through year-to-date 2024.
4. I See a Bad Moon Rising
Last week, I highlighted Gold and Bitcoin (here and here, respectively).
Over the weekend, when I was considering what these two assets had in common (other than the fact that some call Bitcoin digital gold), I came back to something I wrote about (actual) Gold - it’s an uncertainty hedge.
Investors tend to gravitate towards both Bitcoin and Gold in times of uncertainty.
And that’s when I decided to take a look at 10-Year US Treasury Yields.
Last week, when Fed Chair Powell spoke, he said:
"We are waiting to become more confident that inflation is moving sustainably down to 2%. When we do get that confidence, and we’re not far from it, it will be appropriate to begin to dial back the level of restriction so that we don’t drive the economy into recession.”
After Powell’s comments markets priced in an increased likelihood of the first Fed rate cut occurring in June.
All else equal, a rate cut should mean that future growth and inflation will be higher.
Typically, growth and inflation are priced directly into 10-Year Yields (meaning higher growth and inflation often lead to higher 10-Year Yields).
However, there is a 3rd component that impacts 10-Year Yields known as Term Premium.
Term Premium reflects the amount above or below the combination of future growth and inflation that investors are willing to pay for the safety of Treasuries.
Looking at the chart below, we can see that Treasury Yields have trended down while the market has gained confidence in a Fed cut.
In our view, this is likely because investors are paying a premium for the safety of Treasuries despite the fact that growth and inflation expectations are moving higher.
In other words, the same uncertainty that is driving gold and bitcoin prices higher may be driving 10-Year Treasury Yields lower.
With 10-Year Treasury Yields in an area that has seen buying and selling in the past, we believe a resolution - either higher or lower - will be informative.
(This is not a investment advice and is not recommendation to buy or sell any security).
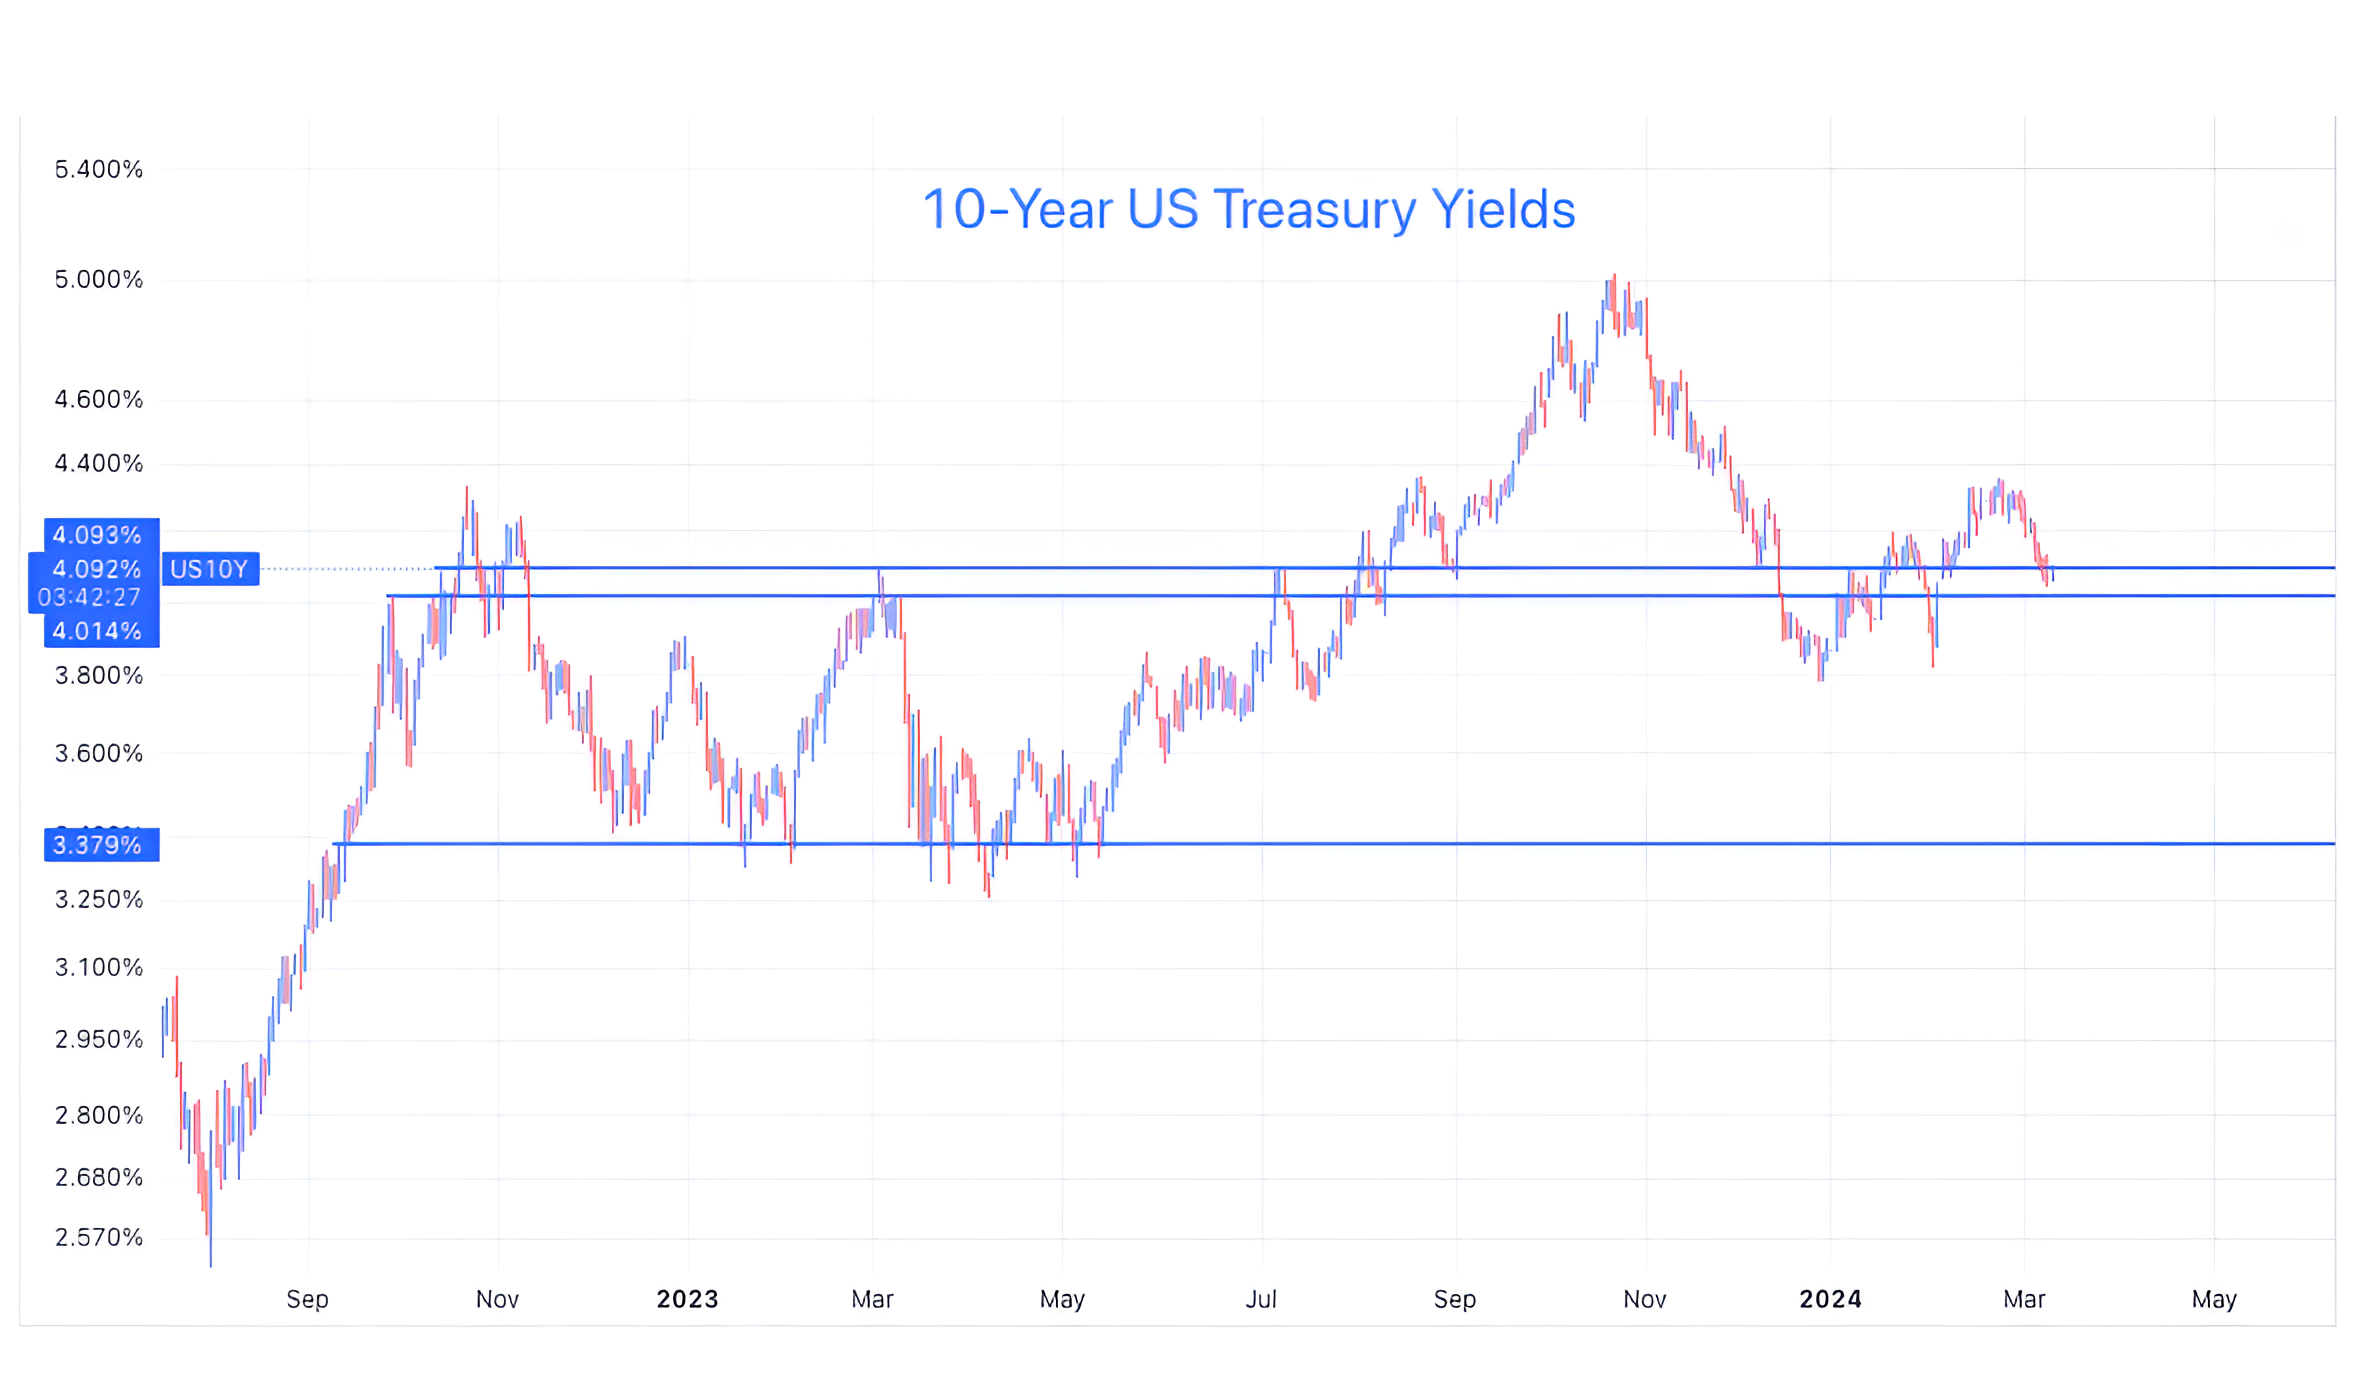
Source: TradingView. Through year-to-date 2024.
5. Is Yen the Straw that Stirs the Mag 7 Drink?
As we highlighted at the top, the Bank of Japan (BOJ) is expected to raise its policy rate for the first time since 2007 and potentially loosen its Yield Curve Control / Quantitative Easing program.
The Yen, as can be seen, reacted by moving down 3%.
While it is too early to say if the Yen strengthening (moving down) from a level that it has strengthened from in the past is meaningful, the Yen and the Japanese “carry trade” (explained in the introduction) have had often had an impact on markets. (Past performance is not indicative of future results).
We will watch BOJ policy and the Yen reaction, but tightening from the BOJ may be more significant than many are considering.
(This is not a investment advice and is not recommendation to buy or sell any security).
