


Take These Broken Wings...
With policy uncertainty high (but improving from worst case) and sentiment low, can better than feared earnings outlooks with monetary stimulus fuel a continued equity recovery? Let's dig in...

Is this a rally a siren song meant to entice those that either sold or didn’t buy at the recent low or is this the beginning of an advance to new all-time highs?
In our view, unfortunately, the answer to that question may be policy dependent.
While it seems that the worst case scenario for the tariff policy may be in the past, this White House and administration has shown an incredible ability to be unpredictable and surprise markets.
We are hopeful that Peter Navarro, the Counselor to President Trump and the architect behind the “reciprocal” tariff plan and its nonsensical calculations, has lost the ear of the President and that more pragmatic advisors are influencing policy.
With that in mind, since early in the year, we have been focused on:
a) the transition for Treasury Secretary Yellen to Treasury Secretary Bessent; and
b) how Treasury Secretary Bessent would address the challenges he inherited of the debt maturity wall (chart 1 here), the fiscal deficit (chart 4 here), interest expense (chart 3 here) and outstanding US debt ($37 t - no chart).
As we wrote in early January (here):
“As we enter 2025, we view Yellen handing off the Treasury responsibilities to Scott Bessent almost like a juggler giving way to a replacement with multiple balls in the air.
While there is the possibility that the hand-off goes smoothly, there’s also the risk that one or more of the balls drop. Adding to this potential complication is the fact that the Biden and Trump administrations clearly have different priorities and policy initiatives.
This transition will occur with US equities at historically elevated valuations.”
The key challenge - in our view - was (is) to keep longer-term interest rates low to refinance the maturing debt while not adding significantly to the annual interest expense.
Our view coming into the year was that:
10-Year US Treasury Yields would move higher as the Treasury began to refinance the $9 trillion worth of securities;
The spike in yields would lead equity markets lower as valuation multiples would contract from their top decile perch in response to higher “risk-free” rates (10-Year US Treasury yields);
The Fed would implement Quantitative Easing (QE) - and essentially go into the market and buy longer-dated Treasuries to reduce interest rates and equities would recover.
With the tariff announcement, which in our view was an attempt at raising taxes to address the fiscal deficit, the initial move in 10-Year US Treasury yields was lower to 3.85%.
However, more recently, 10-Year Treasury Yields risen back to around 4.30%.
While the Fed has remained paralyzed by the potential inflation from tariffs, Treasury Secretary Bessent said that the Treasury has a "big toolkit" — including a buyback program for older securities — to address any severe dislocations in the Treasury market.
As we have written several times over the past six months, they might call QE by a different name, but in our view, buying bonds to lower yields or “to address any severe dislocations” is essentially the same.
While we see lower bond yields (and easier monetary policy) as supportive of higher equity valuations, earnings season has begun and we’re continuing to see future earnings estimates come down.
As we noted last Thursday, next 12 months earnings (Q2 2025 through Q1 2026) are currently $280, it is difficult for us, in the current environment, to consider a multiple of more than 20x for those earnings (5600).
With the S&P 500 at 5400 (chart 1 below), we could see near-term possible upside to 5600 (5630 based on technicals).
On the downside, we continue to believe that there is a 60-70% likelihood that the S&P 500 will revisit its recent lows (4800-4900) (-8-10%) over the next two to three months.
In other words, we see an unfavorable near-term risk reward.
That said, we remain hopeful that a more benign tariff policy, combined with lower taxes (off-setting stimulus) and monetary policy can create a longer-term path back to 5700 and eventually 6000 (+5-11%).
“Take these Broken Wings and Learn to Fly Again” — Mister Mister.
(Several people have contacted me with questions, further details on policy and allocation suggestions, I am happy to help).

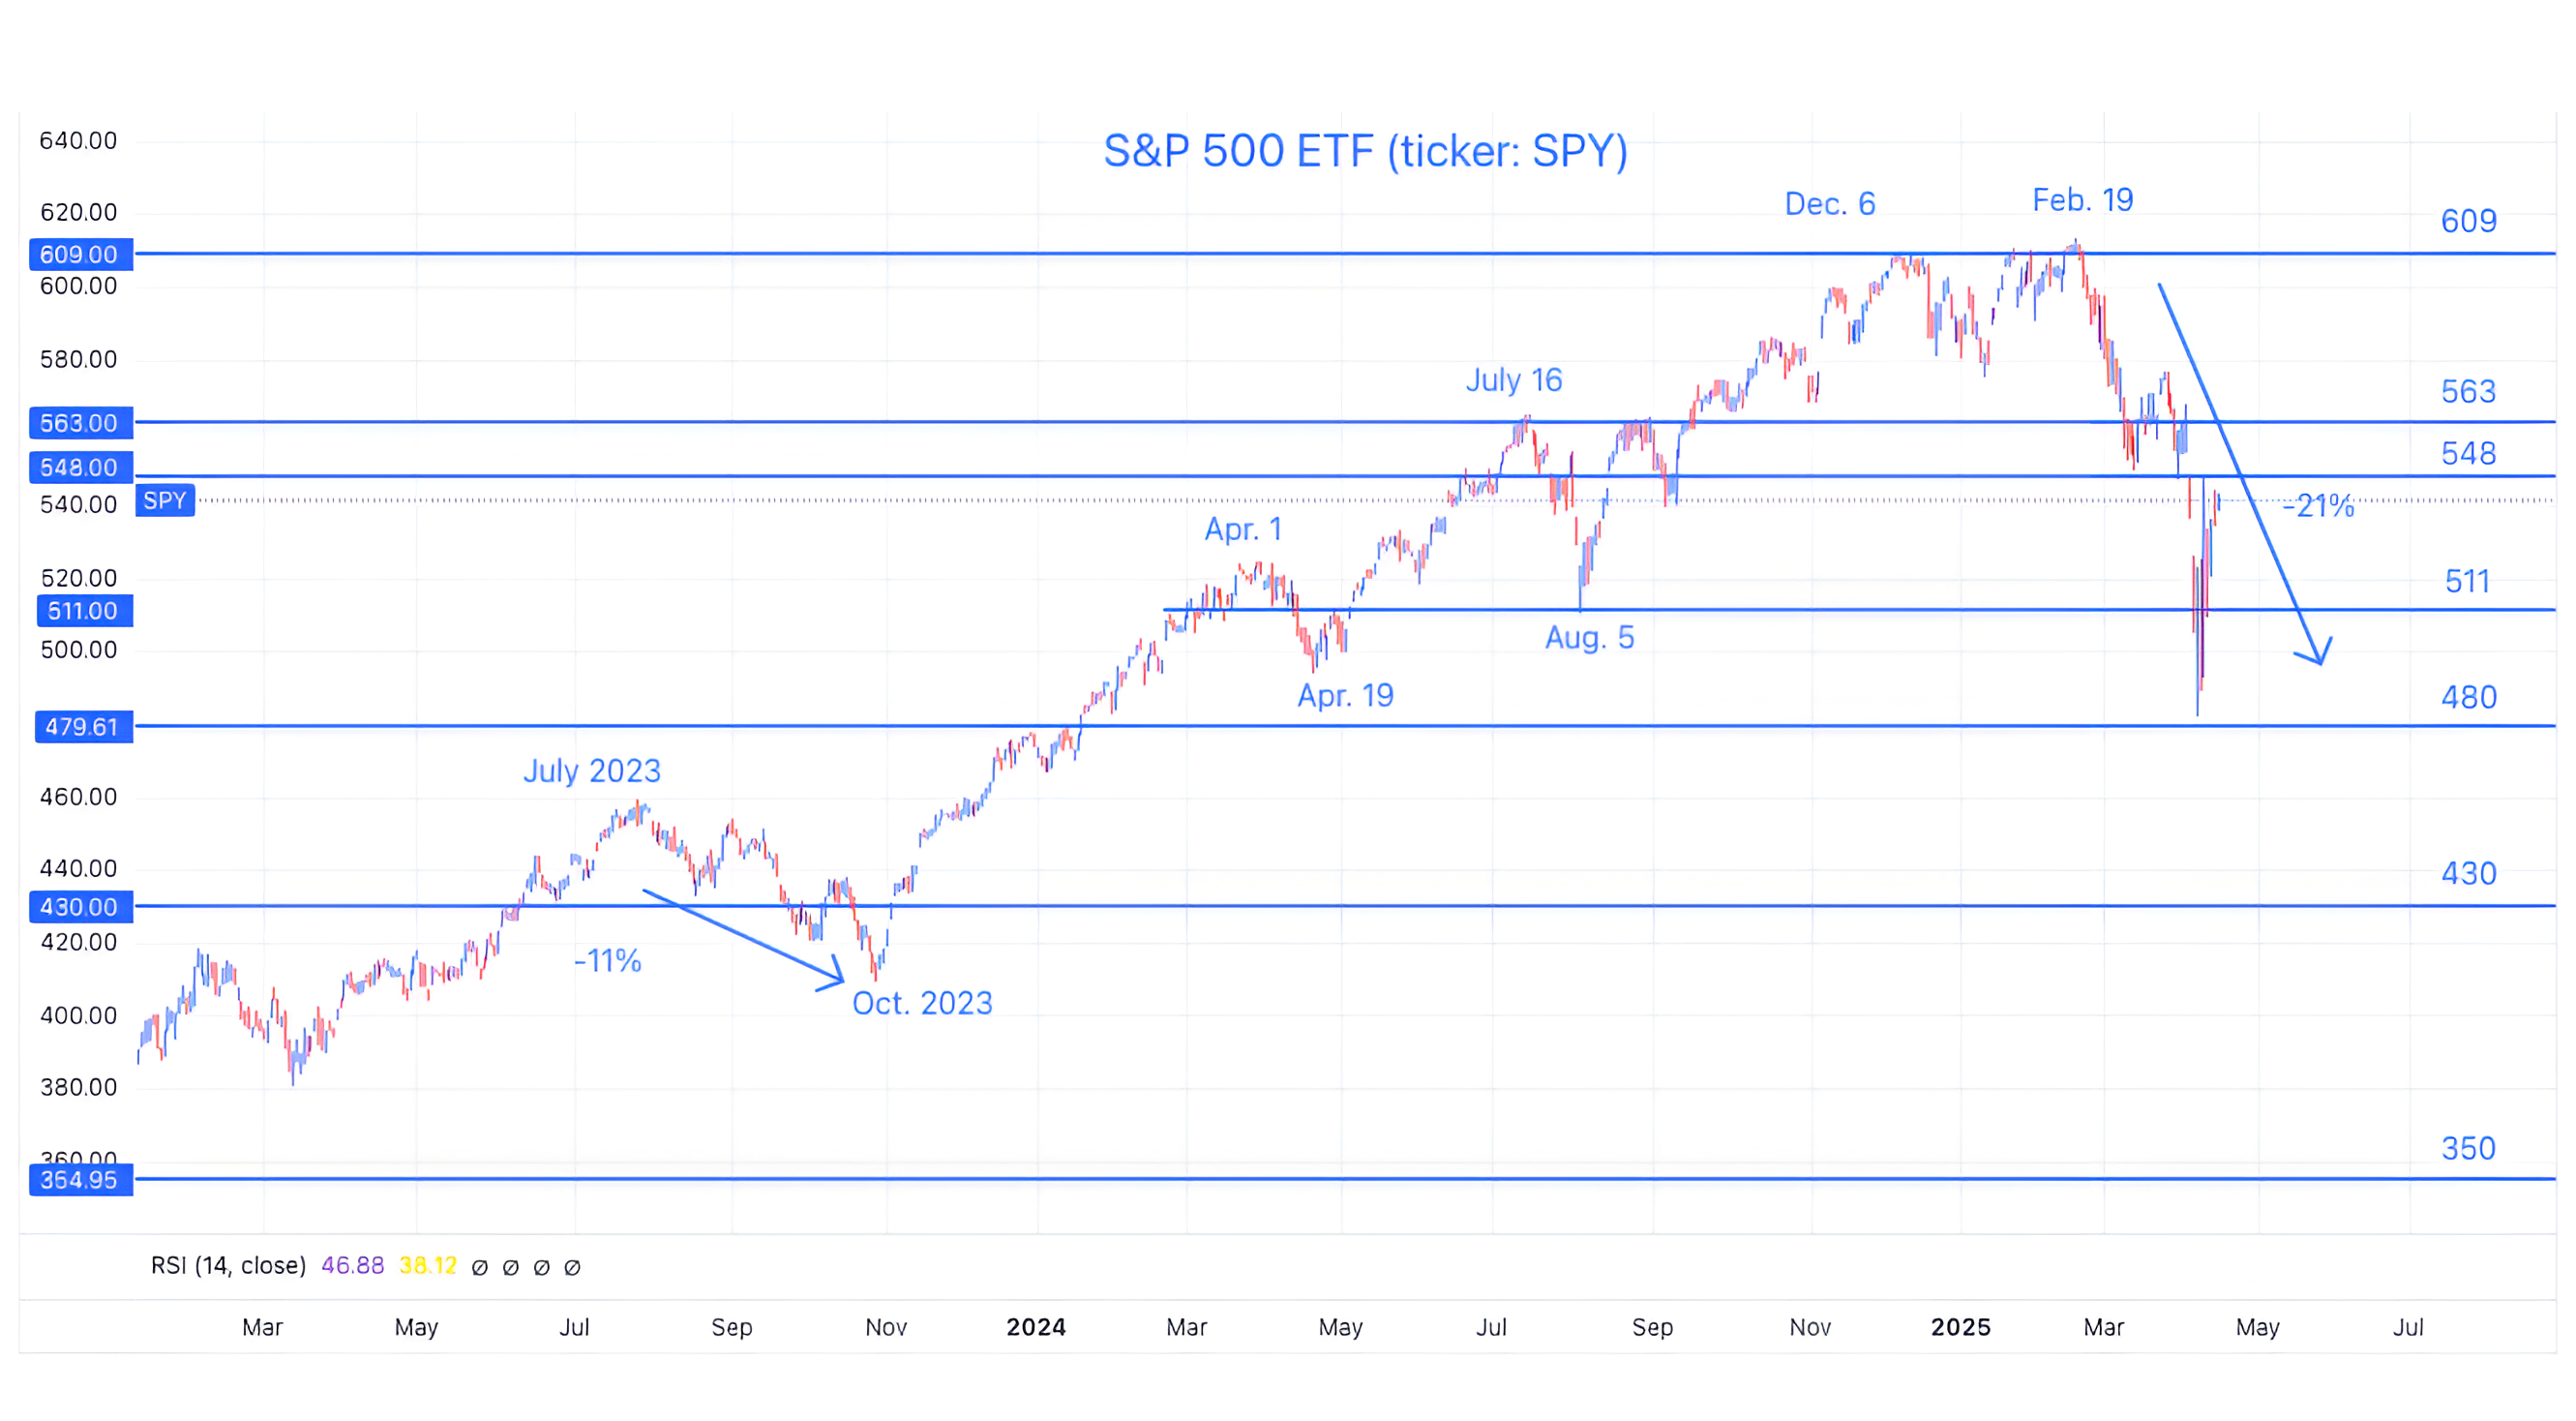
1. S&P 500 ETF: A Pause of Indecision
Source: TradingView. Through year-to-date 2025.
The chart above shows the S&P 500 ETF (ticker: SPY).
The S&P 500 ETF has settled slightly below the 548 level.
The 548 level is where the ETF hit last Wednesday on its aggressive one-day rebound rally. The level represents a 50% retracement of the February 19th to April 7th sell-off.
When we see price on the major indexes begin to settle at what we consider to be a significant level (we identified this level last week - here), we view this as investors awaiting further information prior to reacting.
Whereas we would normally identify earnings and monetary policy as the types of information that investors await, fiscal and foreign policy may be equally relevant in the current period.
If there is perceived good news, we could see the S&P 500 ETF going to 563 (around 5630 on the index) and with bad news, the ETF would head back towards 511.
Ultimately, we expect the S&P 500 ETF to revisit its recent low in the 480 range (4800 on the index), however, this might not take place for two to three months.
(This is not a recommendation to buy or sell any security and is not investment advice. Past performance is not indicative of future results. Please do your own research and due diligence).
2. Technology: Something We’re Continuing to Watch

Source: TradingView. Through year-to-date 2025.
The chart above shows the Technology Sector ETF (ticker: XLK) relative to the S&P 500.
We showed a long-term view of this chart two weeks ago (here).
I’m continuing to show this for five reasons:
I continue to receive more questions on the tech sector and individual tech shares (“Is it time to buy Nvidia?”) than any other sector (maybe all other sectors combined).
The break below the 2023 - 2024 (two year) relative floor (the middle blue line) appears to be meaningful and like the S&P 500 overall is back to what we regard to be a significant level.
If the underperformance in Technology shares (especially large cap tech - Apple, Nvidia, Oracle, Microsoft, Salesforce, Broadcom, ServiceNow) it will represent a major character change in the market - we want to be investing in leaders (companies outperforming the S&P 500).
If the relationship between the Technology Sector can recapture its 2023-2024 range - this would also be critical information in evaluating the overall market character.
Finally, as we wrote when we last showed the relationship: “The Technology Sector is about 30% of the S&P 500 and 50% of the Nasdaq 100. If it is underperforming - it is a drag on the overall index performance.”
(Past performance is not indicative of future results. This is not a recommendation to buy or sell any security and is not investment advice. Please do your own due diligence).
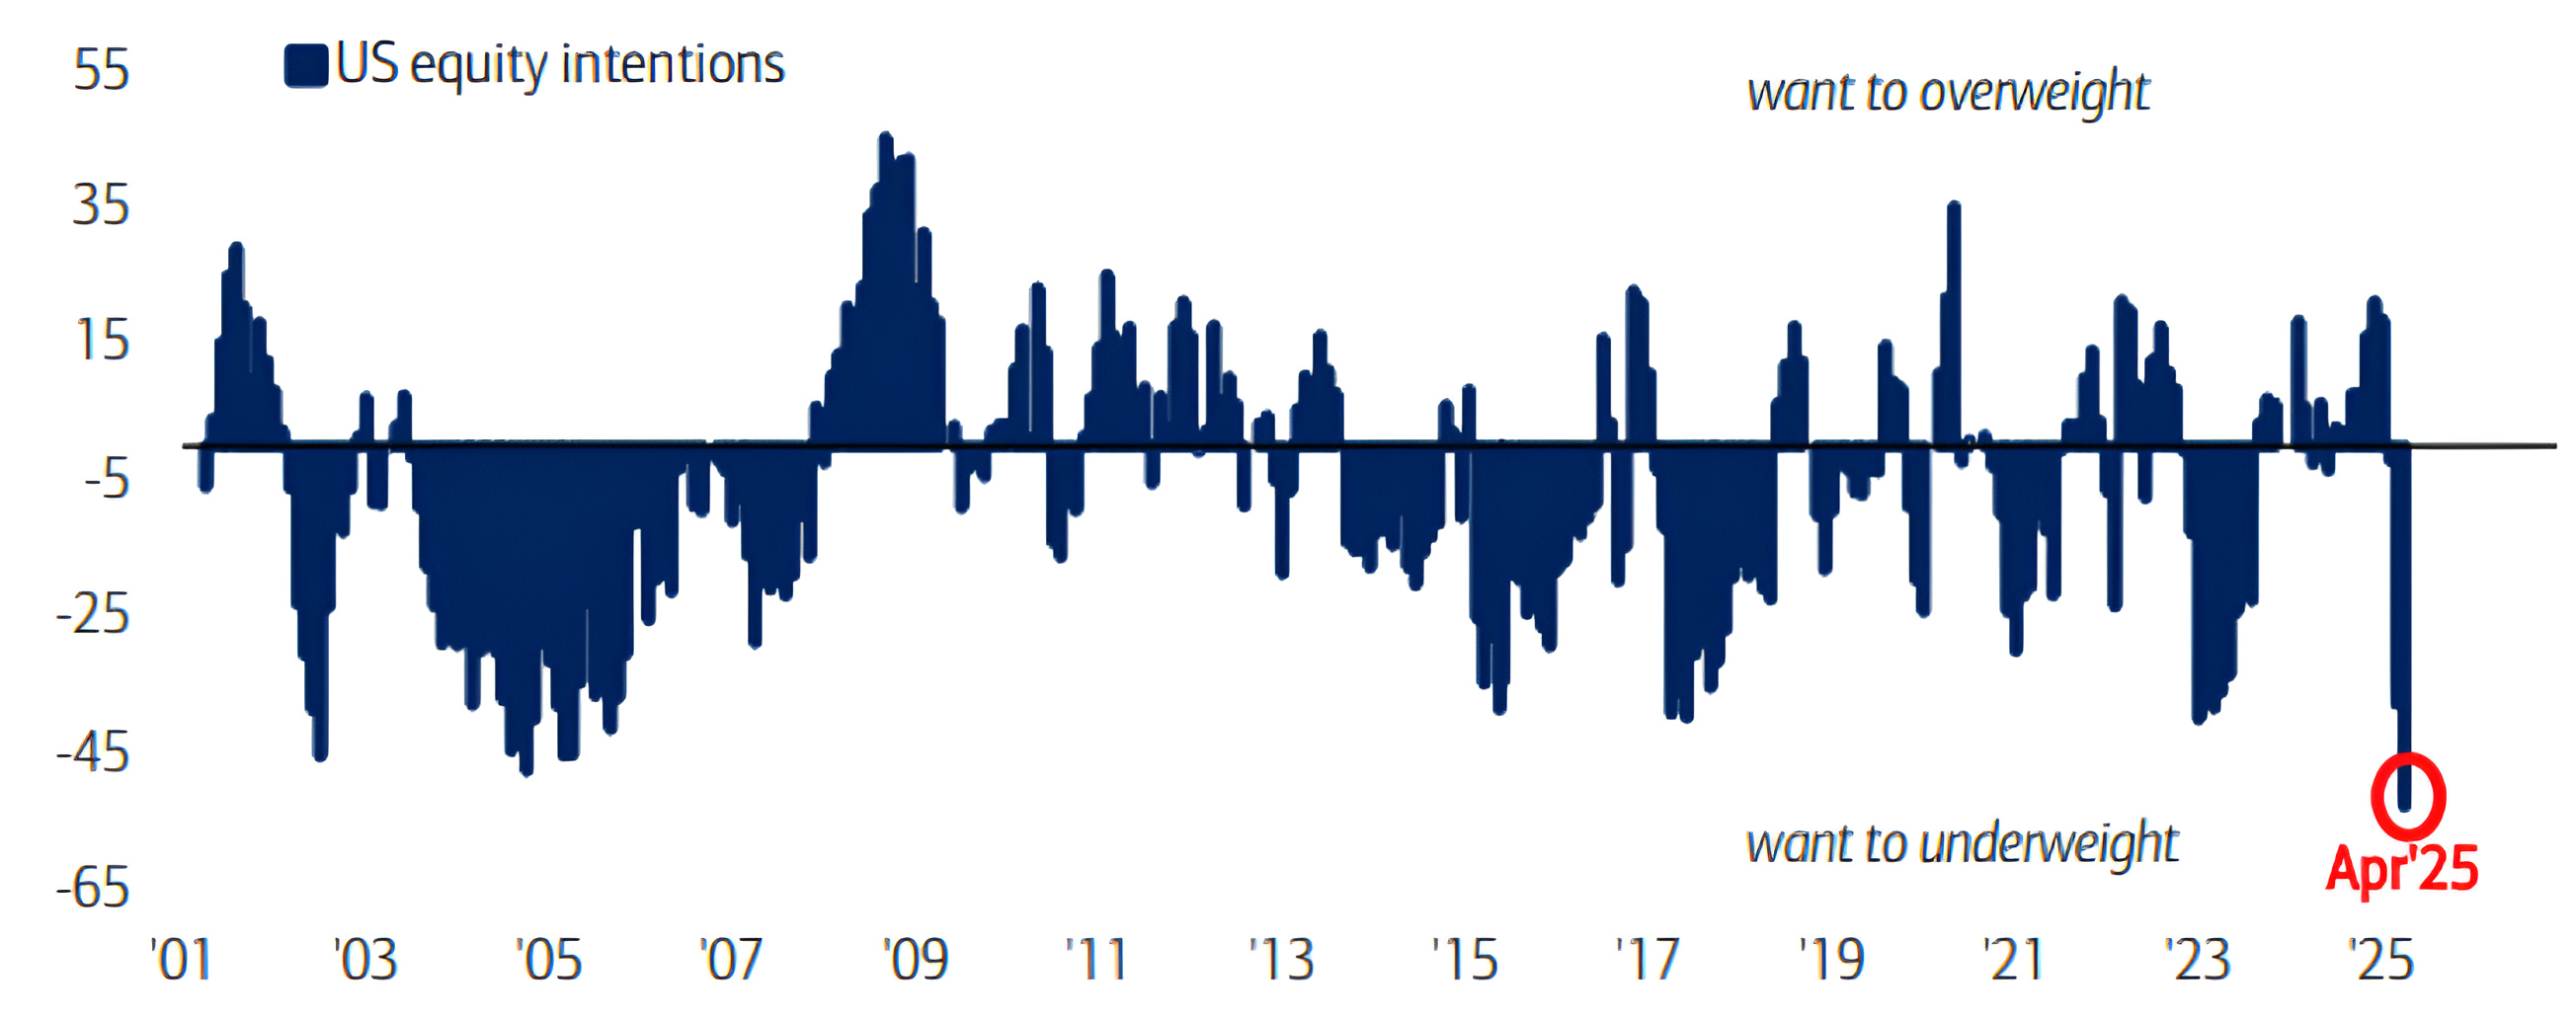
3. Buy When Fund Managers Are Selling
Source: Bank of America “Fund Managers Survey”. Through year-to-date 2025.
The chart above shows the results from the most recent Bank of America Fund Managers Survey reflecting those that want to overweight / underweight US equities.
As can be seen, during the recent sell-off, the greatest percentage of fund managers of the past 25 years wanted to underweight US equities.
It is easy to see that this survey is often contrarian - particularly at extremes.
Along with the spike in volatility, consumer sentiment (chart 5) and other sentiment indicators, we view this as a positive over the long-term.
Over the short-term, we believe there are likely to be better buying opportunities.
(Past performance is not indicative of future results. This is not a recommendation to buy or sell any security and is not investment advice. Please do your own research and due diligence).
4. Oil is Providing Some Relief

Source: TradingView. Through year-to-date 2025.
The chart above shows the price of West Texas Intermediate Crude Oil.
After falling 20% from April 3 to April 8, oil is now trading at its lowest level in three years and is down over 50% from its Russia / Ukraine invasion peak.
While we could make the argument that oil is pricing in a global recession (or at least slow down), lower oil prices are supportive of economic growth.
In general, low oil prices reduce inflation despite not being included in the “core” measures that the Fed prefers to use as an input in its policy decision matrix.
Last week, when we showed core CPI coming down, we remarked that it may provide the Fed with some maneuverability.
We believe that lower oil prices can help anchor inflation and inflation expectations and further support Fed policy flexibility.
(Past performance is not indicative of further results. This is not a recommendation to buy or sell any security and is not investment advice. Please do your own due diligence).
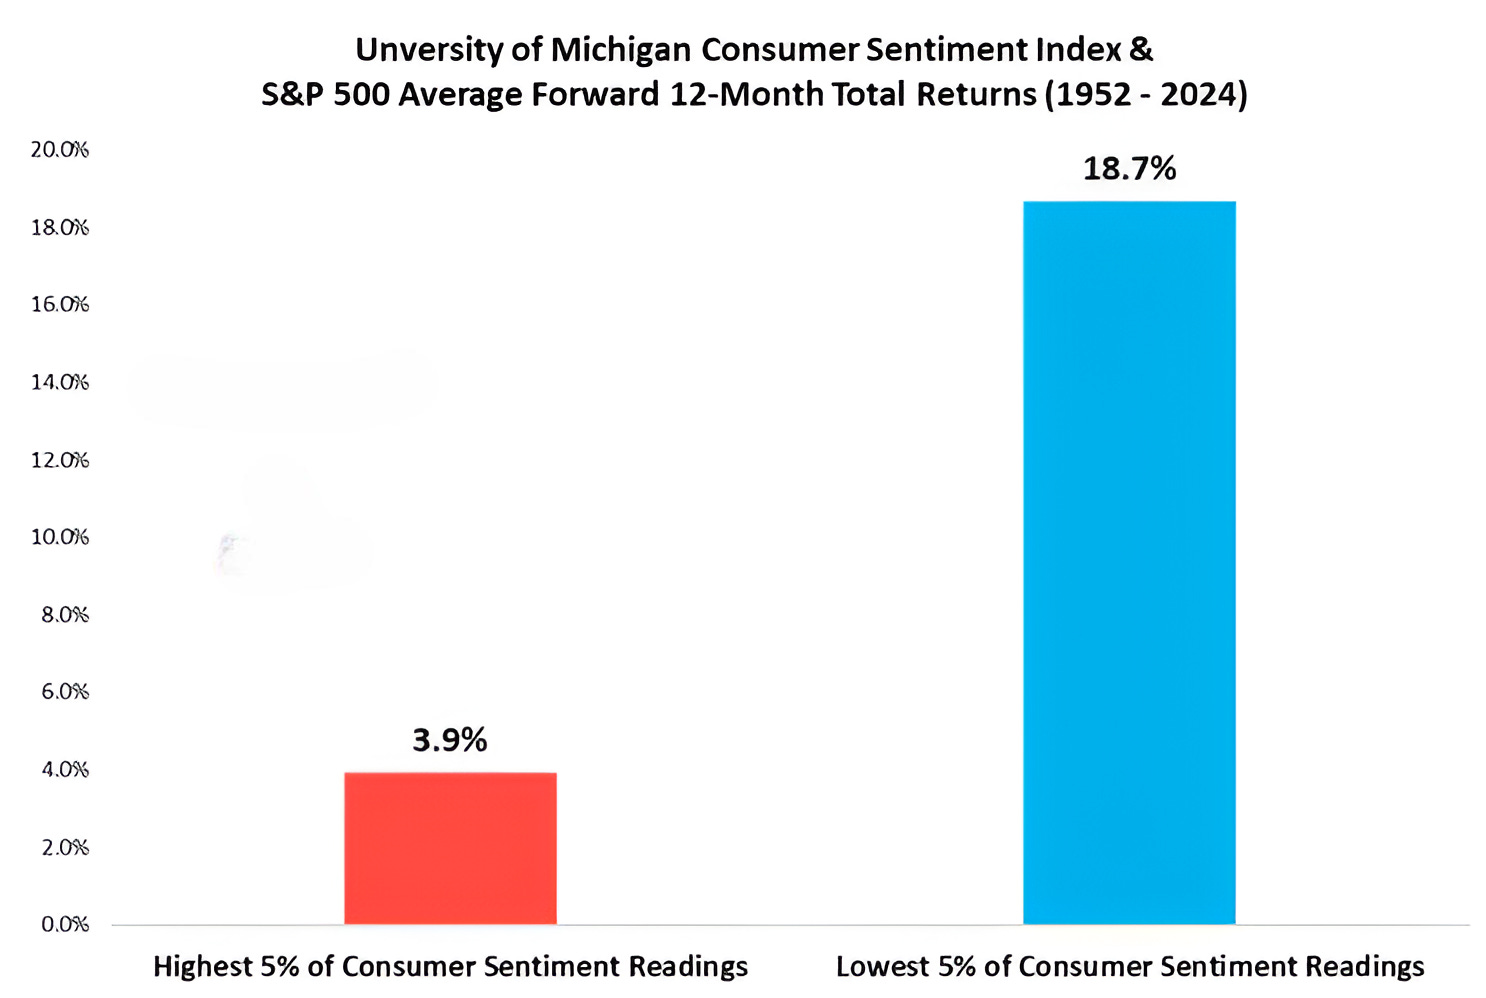
5. Negative Consumer Sentiment = Better Returns
Source: Charlie Bilello / Creative Planning. Through year-to-date 2025. Through year-to-date 2025.
The chart above shows the average forward 12-month S&P 500 returns following the highest and lowest 5% of University of Michigan Consumer Sentiment Readings.
Last week, the University of Michigan Consumer Sentiment survey came in at 57.
To put this in context, since 1960 (85 years), the index has only been below 60 five other times (1973, 1979, 2009, 2011 and 2022).
Notably, it did not fall below 60 during the dot-com bust, covid or 9/11.
As can be seen on the chart, this level of negative consumer sentiment has historically been associated with above average one year returns.
(Past performance is not indicative of future results. This is not a recommendation to buy or sell any security and is not investment advice. Please do your own research and due diligence).