


Stop! In the Name of Love
With the S&P 500 and Nasdaq 100 both achieving our near-term targets and earnings season starting tomorrow, we expect the equity ascent to stop or at least pause. Let's dig in...
For full disclosure - I wrote the headline above and most of today’s note before the market open.
That said, while the S&P 500 and Nasdaq 100 were both down today, the Equal Weight S&P 500 was up 1.2% and the Russell 2000 Small Caps were up 3.6%.
Was this a sell-off or simply a rotation?
While this morning’s CPI report was seen to give cover to the Fed to start cutting rates (odds are September), given last week’s employment report that, in our view, showed some significant cracks in the economic growth story and the two reports on AI that we highlighted on Tuesday (here), we view the equity foundation as increasingly fragile.
As the Nasdaq 100 and S&P 500 have hit our near-term targets, valuation remains elevated (22x next 12 months earnings) and earnings season is increasingly dependent on non Magnificent 7 stocks (the “other 493” see Chart 3).
Within this context, we maintain our view of the S&P 500 (here):
In our view, the rally will continue for the next 3-9 months driven by technicals and seasonality and supported by stealth liquidity and the expectation of improving fundamentals.
While our S&P 500 target is 5500, it is possible in a blow-off top type scenario that the S&P 500 could move to 5600 or even 5800.
However, We continue to believe that at some point, the “bill will come due” in this market and a more extreme correction (~30%) will take place.
In our view, this is likely to occur within the next 6-18 months.”
1. The Nasdaq 100: Achieving (and Slightly Surpassing) Our Near-Term Target

Source: TradingView. Through year-to-date 2024.
We showed the Nasdaq 100 ETF last week (here) and wrote:
Our Nasdaq 100 target reflects the 1.618 extension of the November 2021 to October 2022 sell-off.
Could the Nasdaq 100 move a little above our target?
Absolutely, but our expectation is that there will be a pause and at least a minimal retracement from around that zip code.
With the Nasdaq 100 1% above our target and “in the zip code,” we expect at least a pause at current levels and would not be surprised to see a normal correction (3-5%).
Unless earnings season and corporate outlooks are significantly more disappointing than the consensus is expecting, we expect further upside through year-end.
Furthermore, as we illustrated on Tuesday (in chart 1 here), we expect the Nasdaq 100 to continue to outperform the S&P 500.
(This is not a recommendation to buy or sell any security and is not investment advice. Please do your own research and due diligence).
2. Software: A Pause After a Strong Run
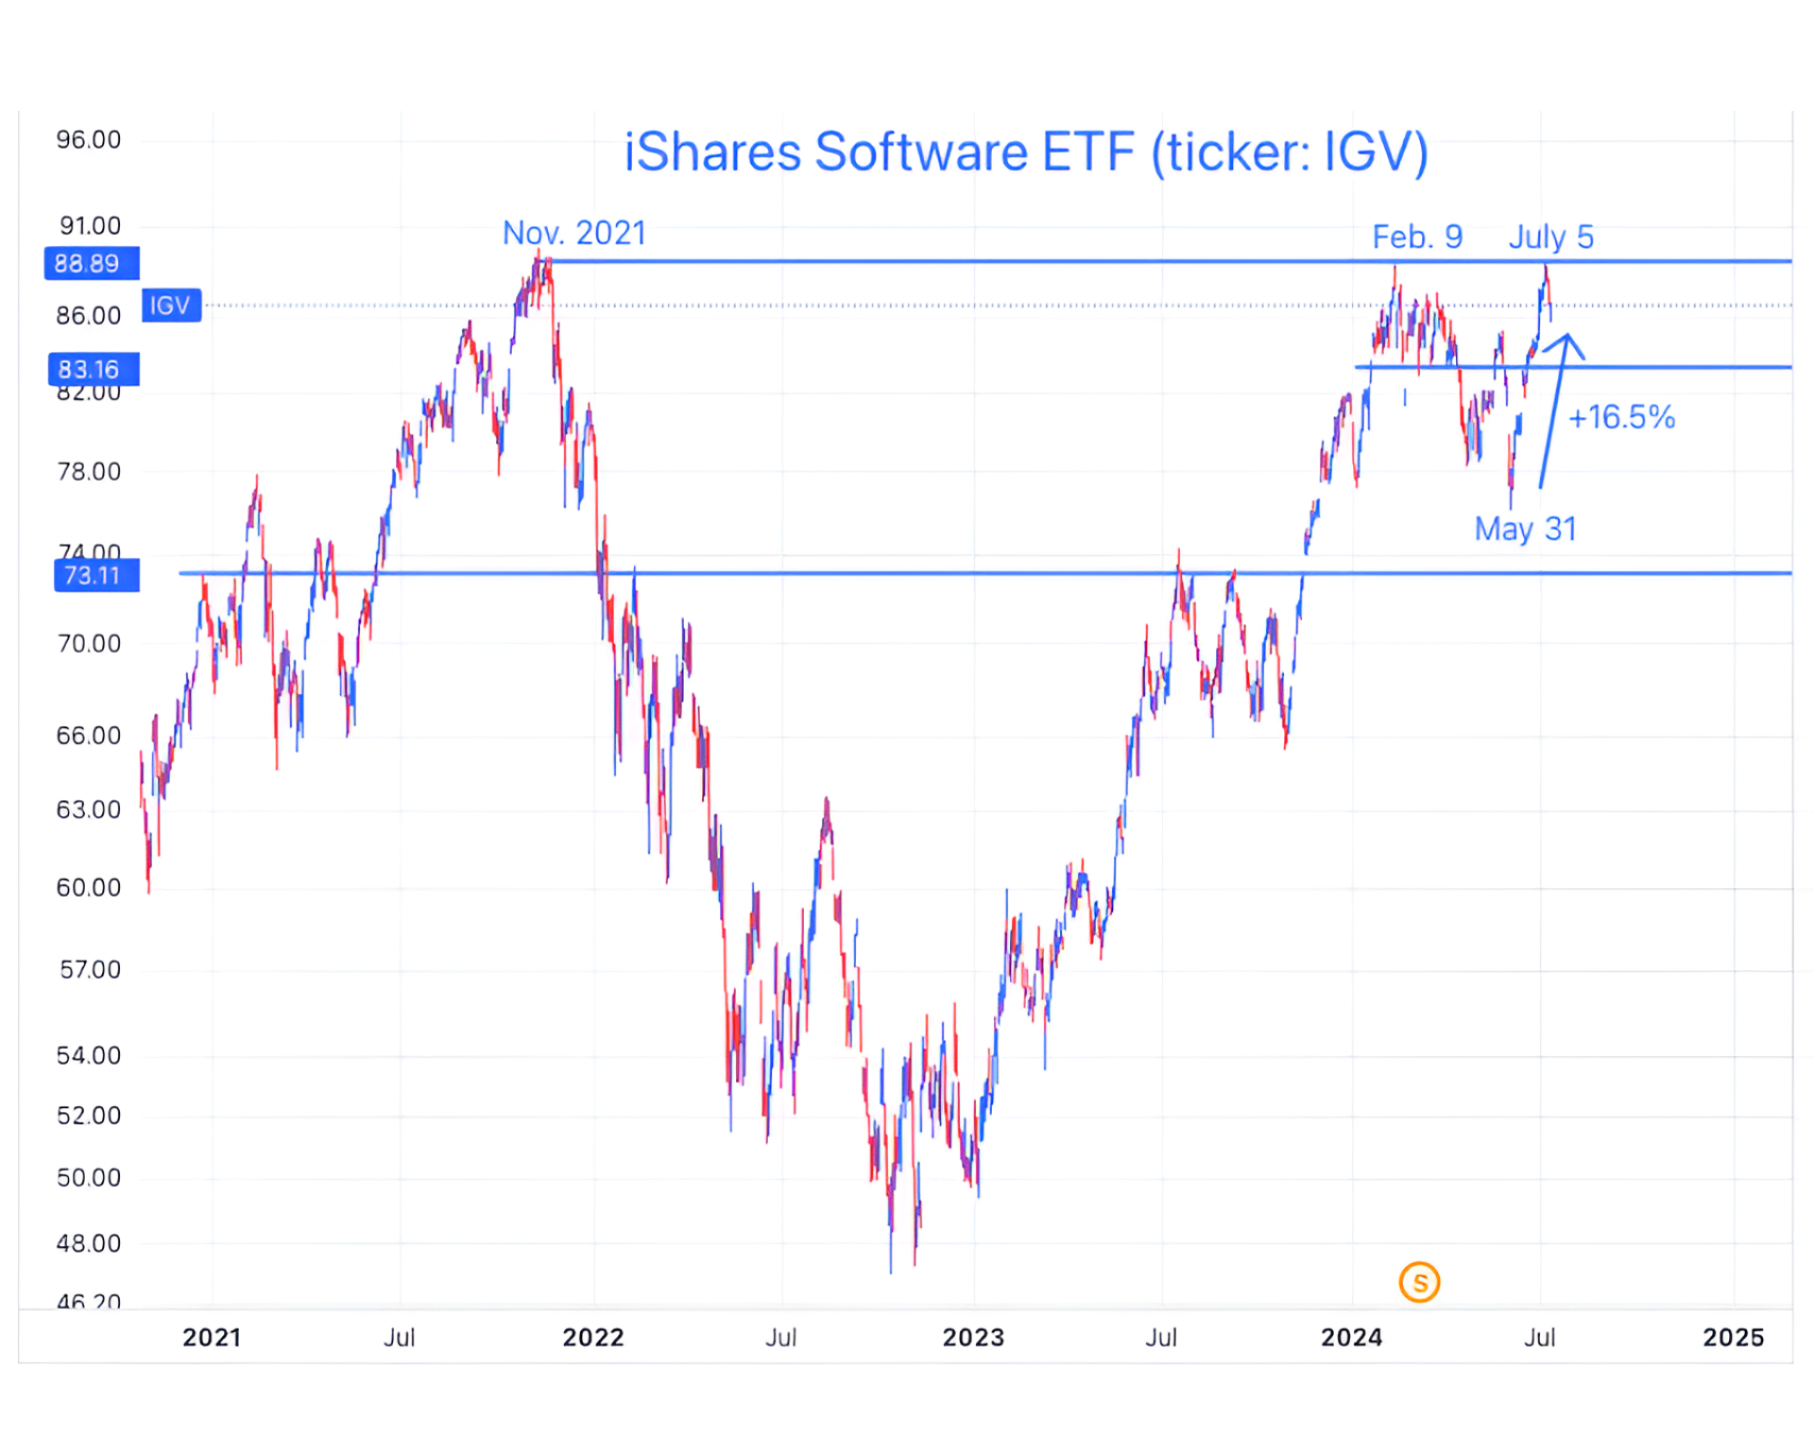
Source: Trading View. Through year-to-date 2024.
The chart above shows the software sector ETF (ticker: IGV).
The top five positions in the ETF are: Salesforce (9%); Microsoft (8%); Adobe (8%); Intuit (7%); and Oracle (7%).
After hitting its November 2021 high in February, the Software ETF fell 13% through the end of May.
From the end of May to July 5, the Software ETF rallied 16.5% right back into its November 2021 / February 2024 high.
We are less surprised to see the pause in the ascent of the Software ETF than we were to see the ascent itself.
We last showed a chart of Software in chart 2 here.
At the time, with the ETF struggling, we questioned whether corporate technology budgets were being allocated away from enterprise software and into AI.
We have also written about what we perceived to be slowing growth in Enterprise Software companies (chart 4 here and referenced in chart 2 here).
At this point, we see the performance of Software shares (as we do the market) as earnings dependent.
In general, the Software ETF is driven by the mega and large cap software companies that have much more stable and predictable earnings streams than some of the higher growth, smaller cloud analytics and network security companies that were the high fliers in 2021.
As a result, while the Software ETF can continue to move higher reflecting the results of the largest companies, the performance may mask challenges under the surface where financial and share price performance have both become more discerning.
(This is not a recommendation to buy or sell any security and is not investment advice. Please do your own due diligence).
3. Counting on the “Other 493”

Source: Strategas, FactSet. Through year-to-date 2024.
The chart above shows the historical and expected earnings growth of the Magnificent 7 and the S&P 500 ex-Magnificent 7 (the “other 493”).
We have consistently written about our concern that earnings expectations appear elevated relative to what we believe is realistic.
In many investment environments, this might be ok, but during a period in which the S&P 500 is trading at 22x next 12 months expected earnings, the index may be more sensitive to the ability of companies to meet expectations.
Within this context, we find it notable that the earnings growth baton seems to be being handed off from the Magnificent 7 to the “other 493.”
Since the beginning of 2023, basically all of the S&P 500 earnings growth has come from the Magnificent 7.
As the comparable periods for the Magnificent 7 from the last year become more challenging, despite what are likely to be impressive results, earnings growth will slow.
On the other hand, the “other 493”, which have exhibited little to no earnings growth over the past year, are expected to begin to deliver 12-15% growth per quarter beginning in Q3.
We continue to view earnings growth expectations with skepticism and we are concerned that in an environment with elevated valuation multiples, this scenario increases the possibility of a drawdown.
(Past performance is not indicative of future results. This is not a recommendation to buy or sell any security and is not investment advice. Please do your own due diligence).
4. A Typical Recovery

Source: Carson Research / Ryan Detrick. Through year-to-date 2024.
The chart above shows the S&P 500 performance one- and two-years after the bottom of a 20%+ drawdown (“bear market”).
One-year after the October 2022 low, the S&P 500 was up 21% vs. the historical average recovery of 38%.
However, with the S&P 500 now only 21 months from the low, it has now caught up to the 2-year (24 month) average recovery of 58%.
In other words, one-year off of the October 2022 low, the recovery in the S&P 500 appeared to be lackluster, but the performance has accelerated in year 2 and the index has achieved the average post 20%+ drawdown 24-month return in only 21 months.
(Past performance is not indicative of future results. This is not a recommendation to buy or sell any security, please do your own research).
5. EM Equities: the Bounce Continues

Source: Trading View. Through year-to-date 2024.
The chart above shows the Emerging Markets ETF (ticker: EEM).
The last time we showed the Emerging Markets ETF (here), we acknowledged that it had bounced from its 2022 / 2023 ceiling and seemed to be heading higher.
At that time, the countries leading the ETF higher were Taiwan and India.
More recently, Mexican and Brazilian equities have begun to move higher, while Chinese equities have stopped falling.
We view this broadening out in the participation of the upside as a healthy dynamic.
Typically, Emerging Markets equities perform well when the US dollar falls. IF this were to happen, we would expect to see further upside from the Emerging Markets ETF.
(This is not a investment advice and is not recommendation to buy or sell any security).