


Love is a Battlefield
As the S&P 500 and Nasdaq 100 look stretched (too far, too fast), we're checking in on the Equal Weight Nasdaq 100 where a battle continues. We also take a look at past drawdowns. Let's dig in...
1. Can the Equal Weight Nasdaq 100 Break through Its Current Ceiling?
Source: TradingView. Through year-to-date 2024.
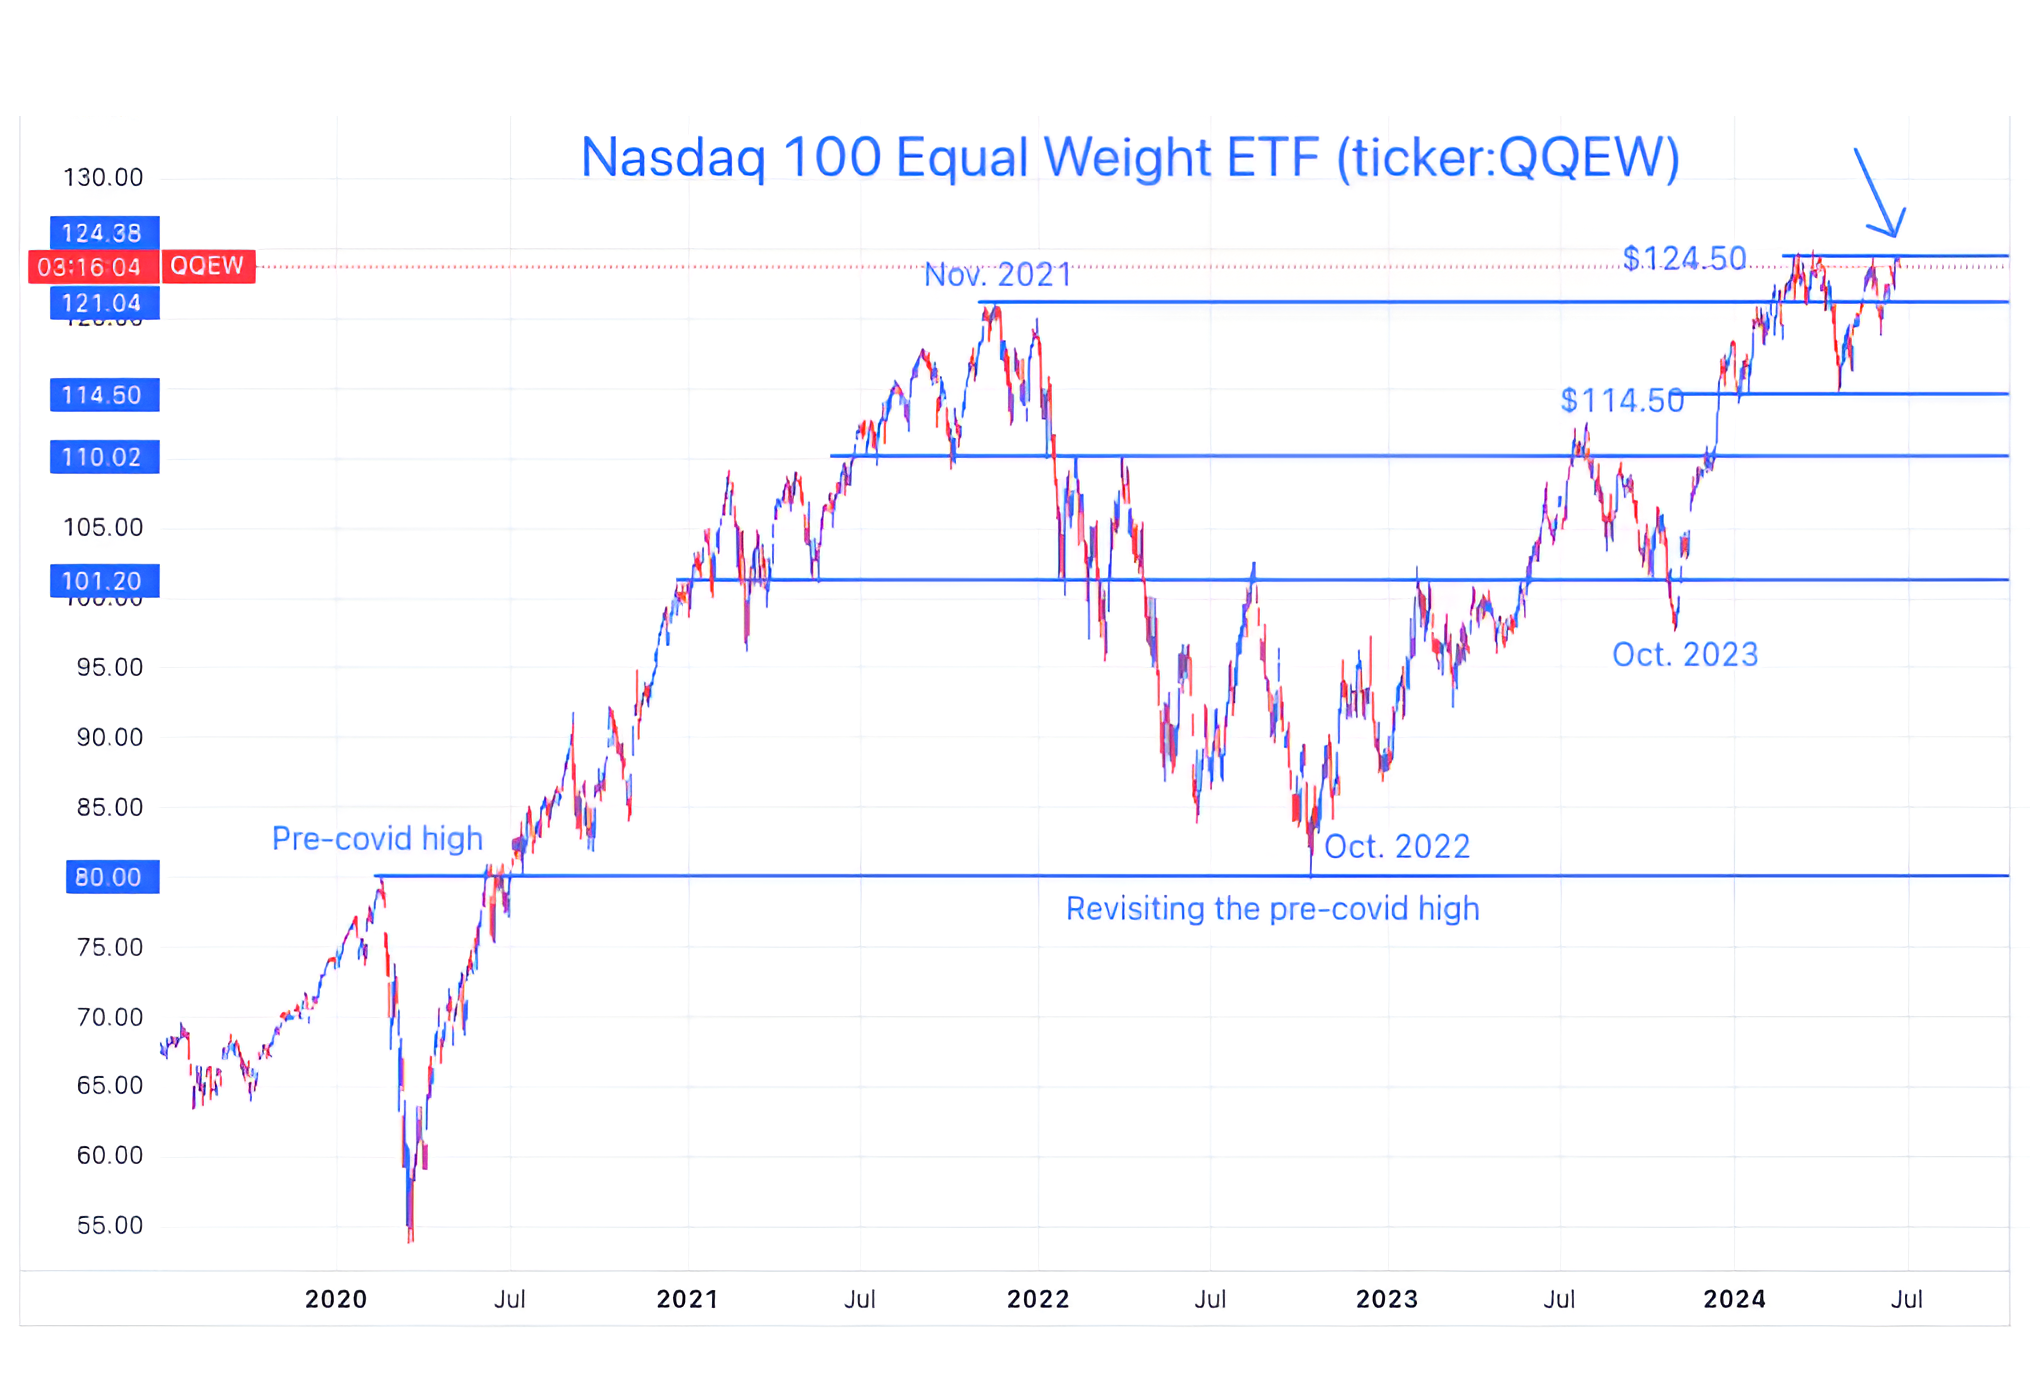
The chart above shows the Equal Weight Nasdaq 100.
In general, we have been noting how “narrow” the market has been. (Chart 3 here and chart 5 here).
Specifically, we have been highlighting the disparity between the S&P 500 (here) and the Equal Weight S&P 500 (here) as the S&P 500 has made several new all-time highs over the past 3 months while the Equal Weight S&P 500 peaked at the end of March.
While the Nasdaq 100 has made new highs - similar to the S&P 500 - the Equal Weight Nasdaq 100, unlike the Equal Weight S&P 500, has been fighting to make a new all-time high.
We last showed the chart above over a month ago (here).
At the time, we wrote “we wouldn’t be surprised to see a brief pull back before the climb back to the March 21st high.”
Here we are.
The Equal Weight Nasdaq 100 is back at the ceiling level (top light blue horizontal line) that it first hit in early March and revisited on March 21 and the end of May (shortly after we last showed the chart).
If the Equal Weight Nasdaq 100 were to sustainably move to a new all-time high, we would view this as “confirmation” of the move higher in the overall Nasdaq 100.
In other words, this would reflect a broadening out of participation - at least in the growth oriented Nasdaq 100 shares.
(This is not a recommendation to buy or sell any security and is not investment advice. Please do your own research and due diligence).
2. Very Little Daily Volatility
Source: Goldman Sachs. Through year-to-date 2024.
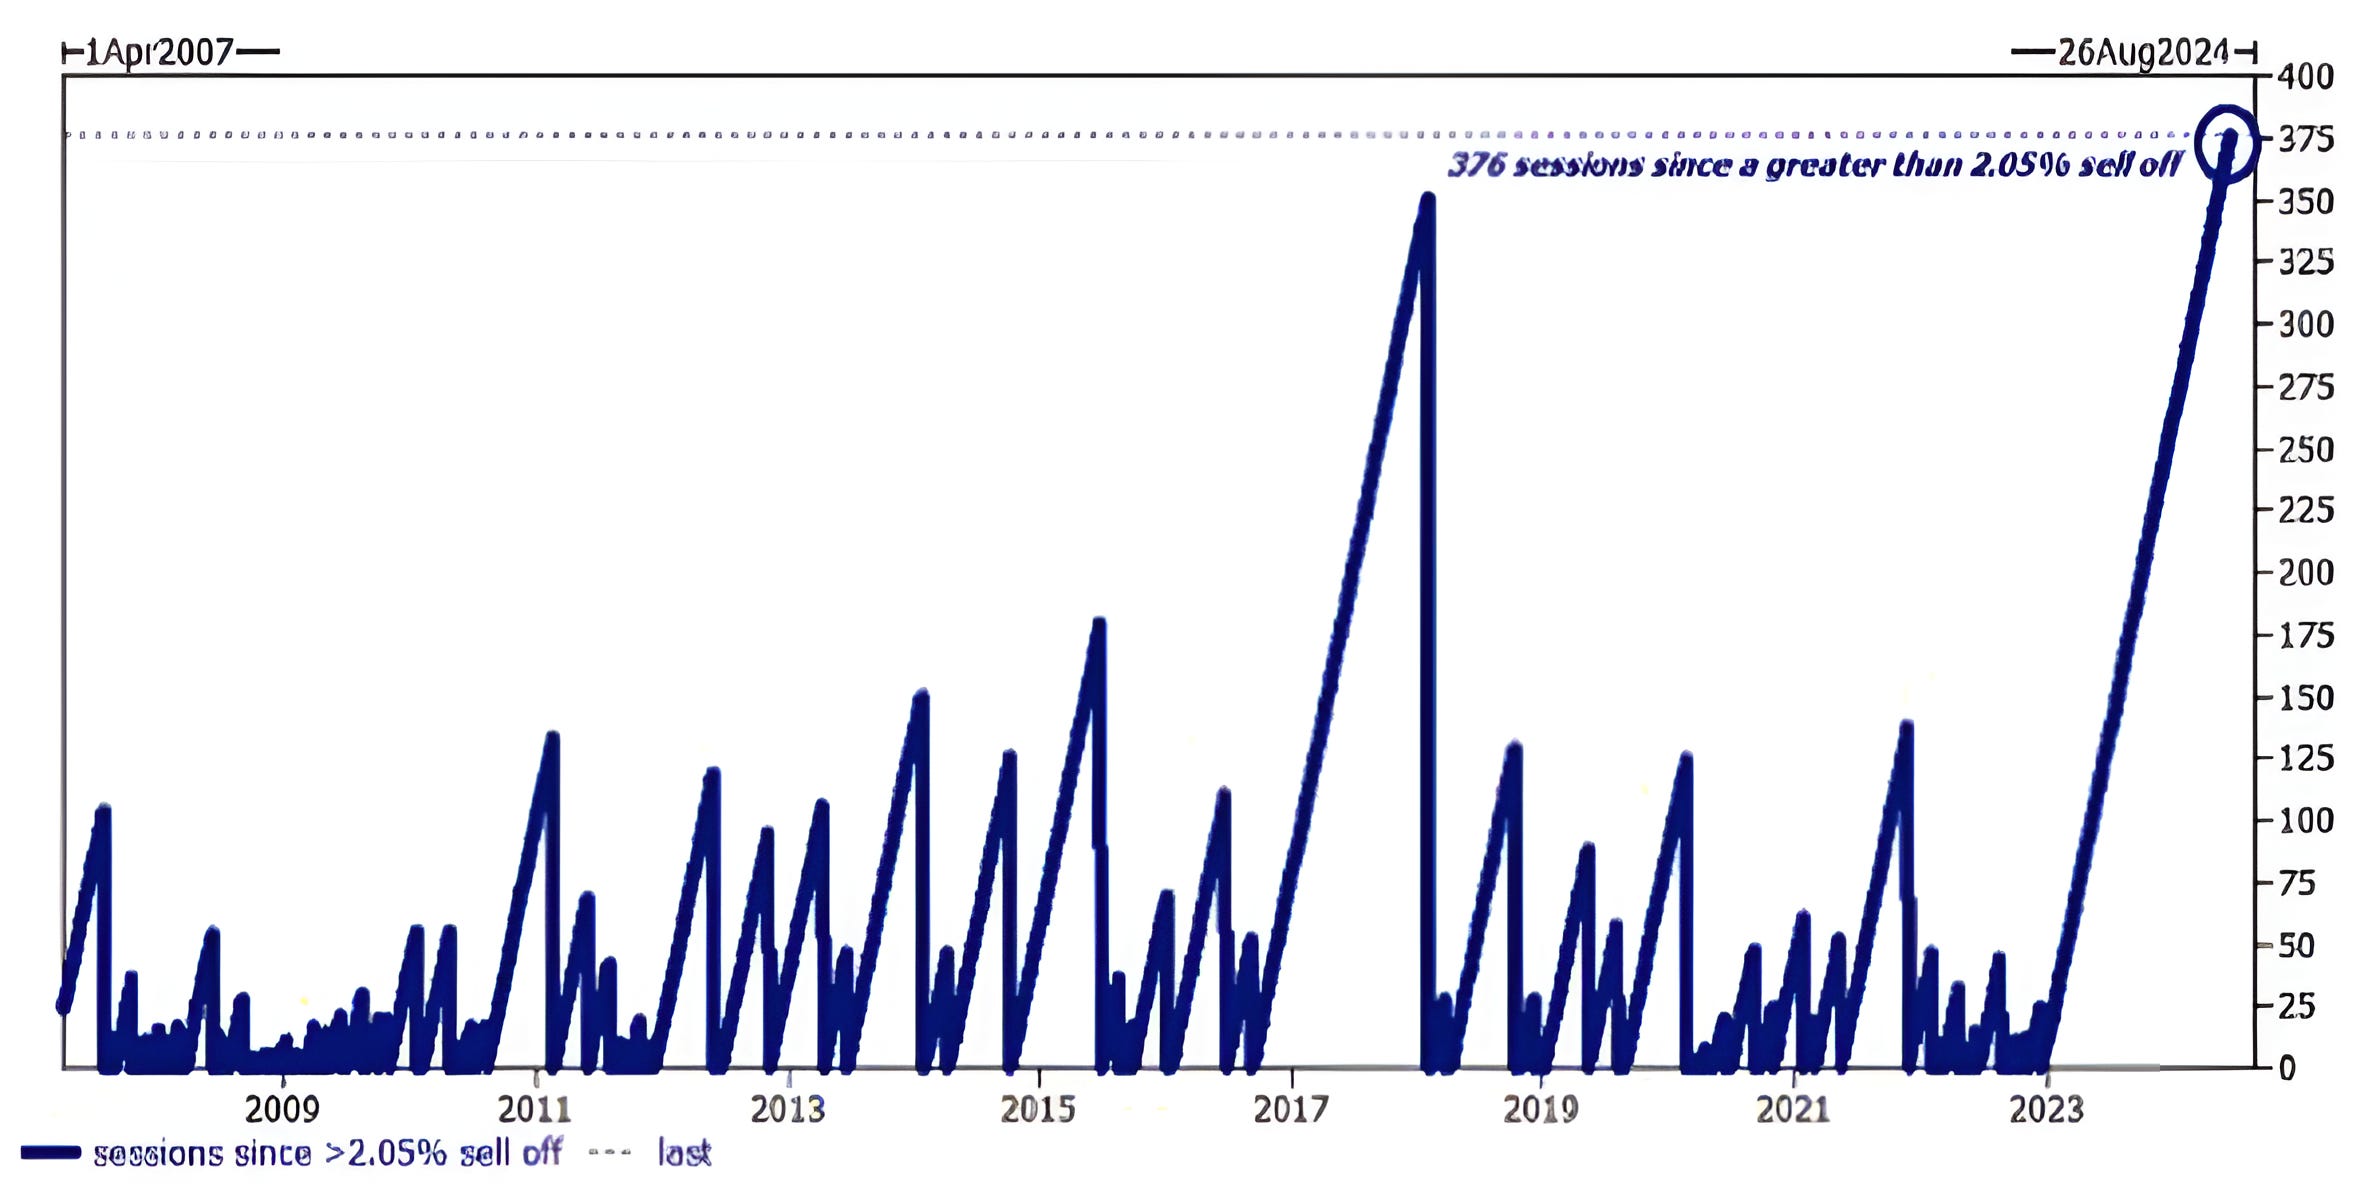
The chart above shows the number of S&P 500 trading sessions since a 2.05% (or more) 1-day selloff.
In the current period, the S&P 500 has gone 3 times as long (376 sessions) without a 2.05%+ one day sell-off compared to what seems to be the normal duration (125 days).
Needless to say, at some point a one day 2.05%+ drop will occur again. However, timing it or predicting the catalyst would be impossible.
Rather, I am showing this chart as a reflection of the character of the current market environment and how atypical this period in US equity market behavior has been.
(This is not a recommendation to buy or sell any security and is not investment advice. Please do your own due diligence).
3. All In! (Or at Least All Basically Out of Cash)
Source: Bank of America. Through June 10, 2024.
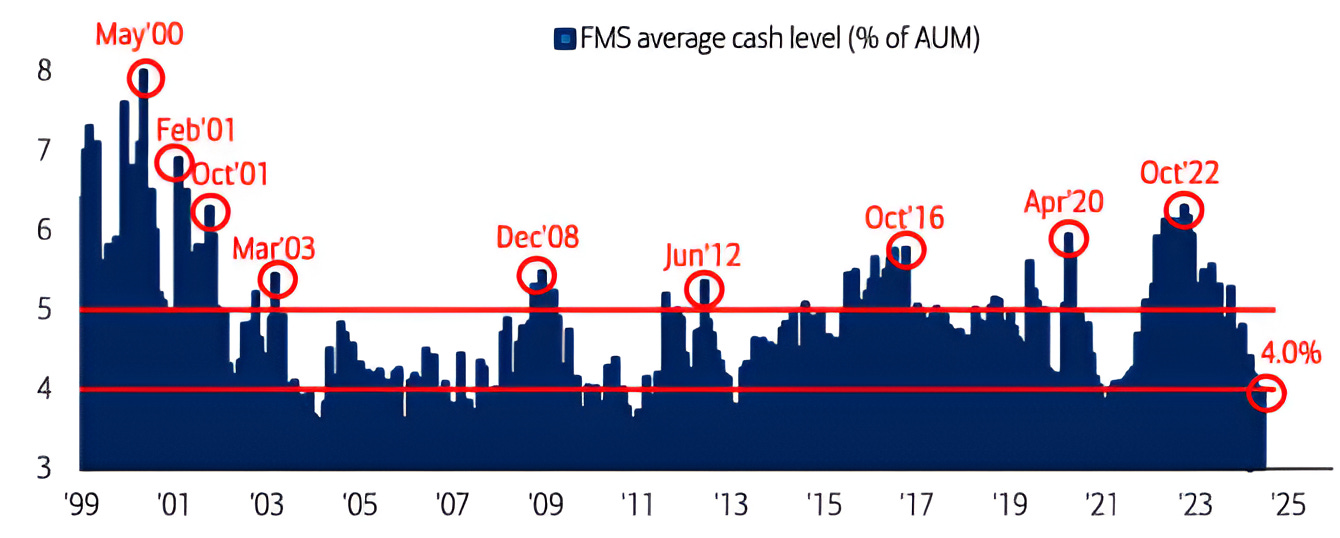
The chart above from the Bank of America Fund Manager Survey (FMS) shows the average fund manager cash level as a percent of assets under management (AUM).
Current cash levels at 4% of assets under management are near the lowest levels since 1999.
Interestingly, near the “dot-com” peak in May 2000, cash levels were at their highest levels of the past 25 years.
More recent peak levels have coincided with market lows.
That said, rough levels in cash have not necessarily been coincident with market tops.
(This is not a recommendation to buy or sell any security and is not investment advice. Please do your own due diligence).
4. The World is Eating Software

Source: William Blair. Through year-to-date May 31, 2024.
The left chart above shows the percent of Software Companies that cut their full year earnings outlook in Q1 and the right chart above shows the Median Growth rate across software companies.
On Tuesday (here), we wrote “While we have seen a semiconductor “arms race” driven by the hyper-scalers (see chart 2 here), enterprise and cloud software has been somewhat left behind.”
Today, we wanted to follow-up that claim with some charts.
As can be seen above, during Q1 2024, 17% of Software companies cut full-year earnings guidance. This was 50% higher than the percent that cut guidance in Q1 2023.
Similarly, median growth has slowed from 16% in 2023 to 12% in 2024.
It may be that many large corporations made significant investments in software over the past five years (move to cloud, cloud analytics, hr systems, crms, security etc.) and now budgets are much more maintenance-oriented and incremental.
While we view this as the natural evolution of the industry, it does not help earnings growth.
There does not seem to be a new “killer app” or must have within enterprise software.
Although we wouldn’t be surprised (and are somewhat hopeful) if some AI-based software became a corporate must have, there is not a current one that we know of (Microsoft pilot? Not likely in its current iteration) that is heading in this direction.
This slowdown in software growth makes the earnings in the technology sector more dependent on hardware (semiconductors).
So far, hardware has delivered, but as we have noted, the earnings outlook is relying on a small subset of companies to drive results - or, as we like to characterize it, fragile.
(This is not a recommendation to buy or sell any security, please do your own research).
5. A Look at Longer-Term US Equity Market Volatility
Source: Carson Investment Research / Ned Davis Research. Through year-to-date 2024.
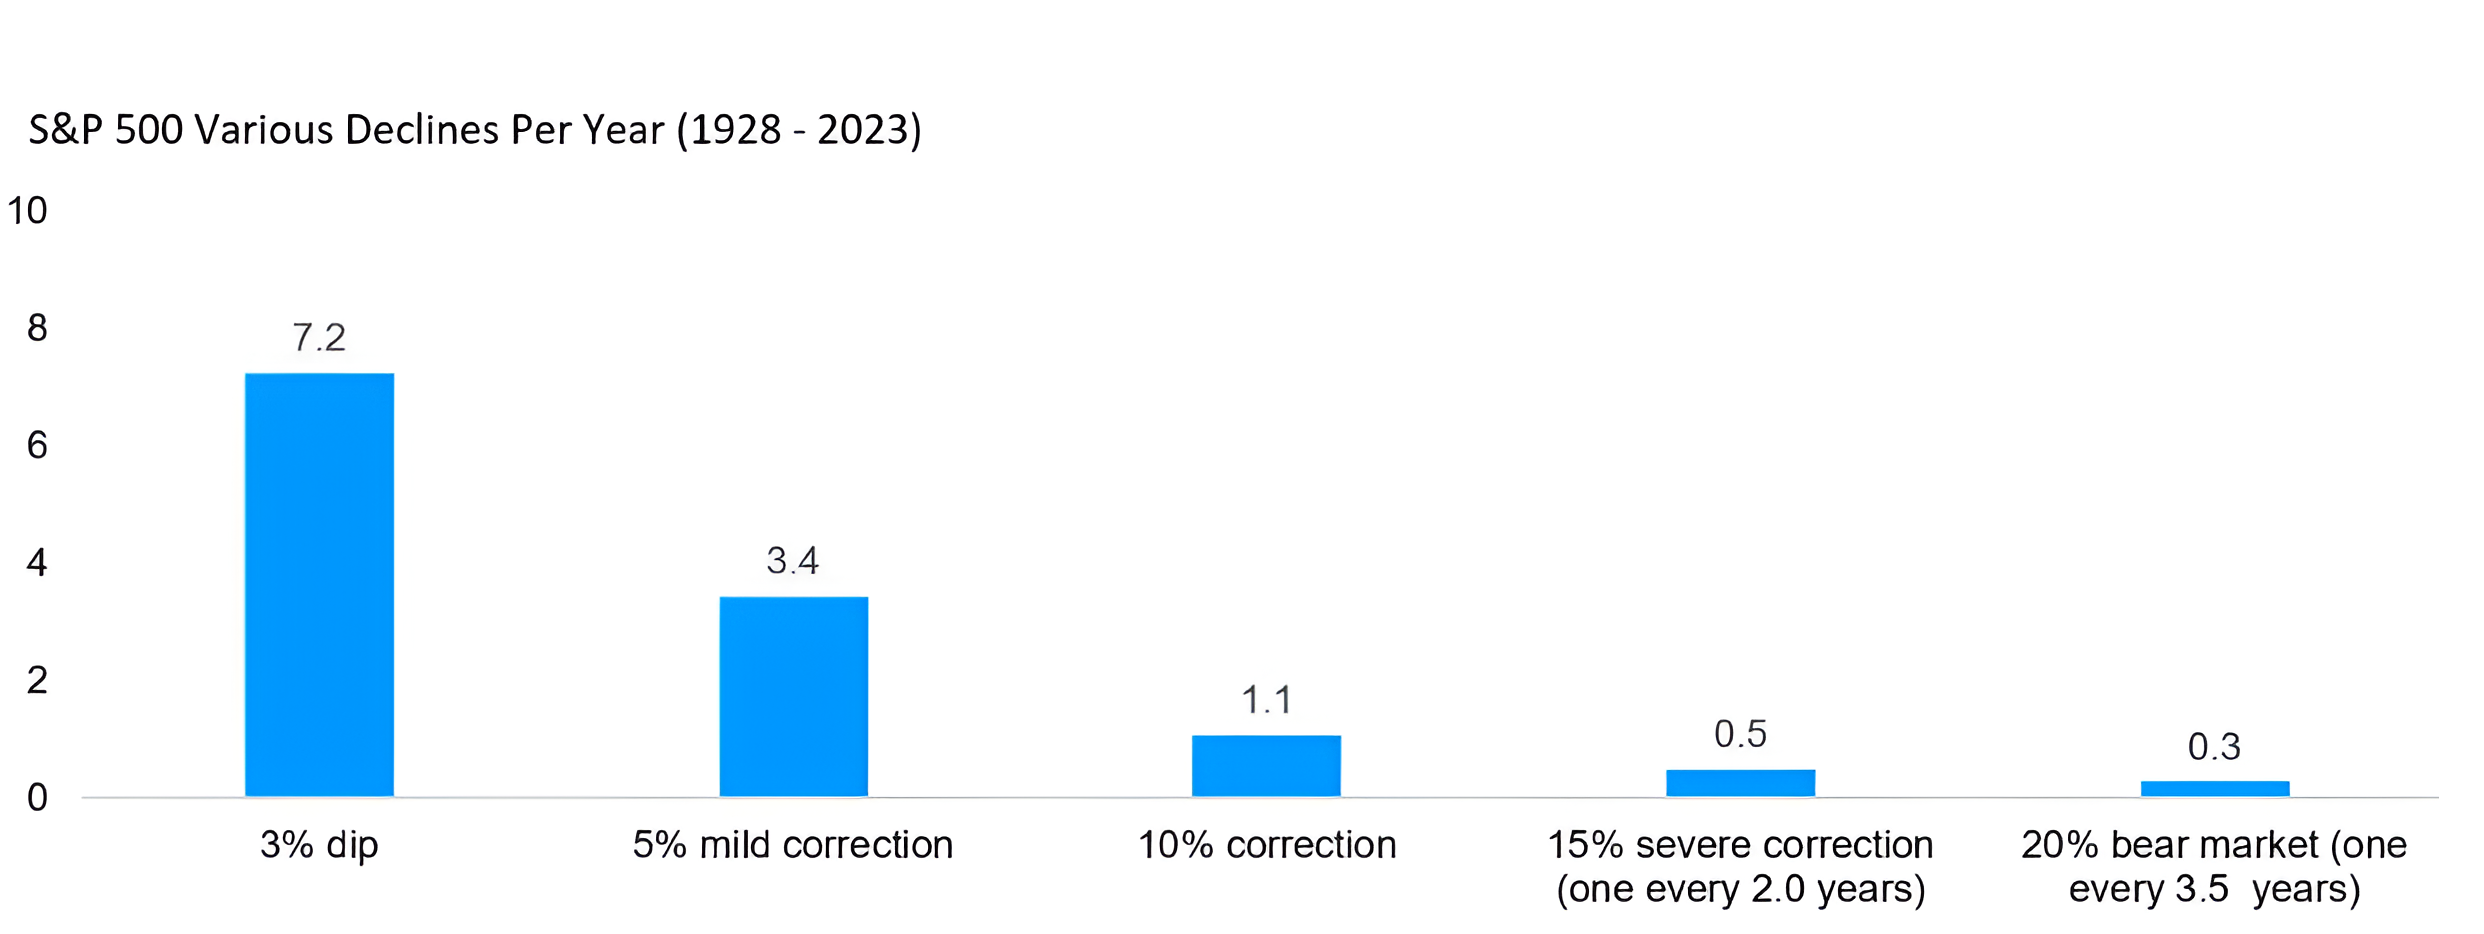
The chart above shows the historic frequency of different draw-down levels in the S&P 500. (Past performance is not indicative of future results).
Historically, on average, there have been seven 3% drops each year; three 5% corrections; and one 10% sell-off each year.
As a reminder, during the first half of April (this year), the S&P 500 fell nearly 6%. (one of this years three 5% drawdowns?)
In terms of deeper sell-offs, historically, the S&P 500 has experienced a 20% bear market once every 3.5 years.
During the first half of 2022, the S&P 500 fell 25%.
As we have written (here), we see the possibility (10-15% likelihood) of a 30% sell-off in the S&P 500 from a 2024 peak of 5500-5800 to a low of 4000-4200 in 2025.
If this were to occur, it would be 2.5 years after the last 20% sell-off - which is faster than the historical average.
Have a great weekend!
(Past performance is not indicative of future results. This is not a investment advice and is not recommendation to buy or sell any security).