


Gotta Have Faith!
The volume on the news seems higher when Trump is in office. Despite the geo-political events and macro volatility, US equity markets are pointing higher and looking through the noise. Let's dig in...

In early May (here), in the introduction, we presented a list of what needed to go “right” to build a constructive case for equities:
“Tariffs settle down at 10% with most trading partners ex-China. Trading deals include lower tariffs on US goods, greater access to non-US markets and some investment in US manufacturing.
Chinese tariffs come down and despite tension, there is detente.
Inflation from tariffs is seen as “transitory.”
The Fed cuts rates in June and one more time before the end of 2025. The Treasury helps contain 10-Year Yields (but doesn’t call it QE - see below).
Trump is able to pass a tax cut that doesn’t lower taxes as much as he wants, but he declares victory and calls it the greatest middle class tax cut ever.
Despite S&P 500 earnings slightly missing current 2025 expectations ($260 vs. $265 expected); due to a combination of tax cuts, contained 10-Year yields and easier monetary policy, 2026 earnings are expected to grow 10% to $285 and investors price in another 10% for 2027 to $315.
Investors are willing to place a 20x multiple on 2027 earnings and the S&P 500 rallies to 6300 (12-18 months from now).”
Let’s review where these stand:
Tariffs are settling down.
There seems to be detente with China.
Inflation is trending down and a feared inflation spike doesn’t seem to be on the horizon.
The Fed may not cut tomorrow, but will likely indicate two cuts before the end of the year.
As we noted last week (chart 3, here), the Treasury has begun to help contain 10-year US Treasury yields.
A revised version of Big Beautiful Bill is working its way through the Senate and will likely be passed. (Dan Clifton, our favorite Washington watcher said “the underlying details are radically different than the House bill.”) (discussed in chart 4, below).
2026 S&P 500 earnings are still expected to be $300.
The market is trading at 22x next 12 months earnings (see chart 2, here) and 20x 2026 earnings (rather than 2027 earnings).
We could add to the “bullish list” that tariff revenues have begun to come in to the US. In May, the US received $23 billion from tariffs, up from $6 billion in May 2024.
As we showed in chart 4 here, the US collects about $445 billion a month in revenues. Tariffs increased this by about 5%.
Although many seem concerned about the week dollar (chart 2, below), a weaker dollar is positive for corporate earnings as many companies sell and compete abroad.
Finally, if the Fed can communicate a constructive narrative with likely upcoming rate cuts, the economy could accelerate, while lower 10-year US Treasury yields would allow for cheaper borrowing costs.
In other words, several of the factors we highlighted as foundational for the bullish narrative have occurred while there are further potential catalysts (earnings growth and expectations, Fed cuts, economic growth and contained 10-Year Treasury yields) on the horizon.
Furthermore, AI investment as indicated on Nvidia’s earnings call remains robust.
Given these factors, we could see the market begin to price in $330 in 2027 S&P 500 earnings and apply a 19-20x multiple on those earnings by year-end.
This would imply a year-end target range of 6300-6600.
However, as we have been stating, this will likely not be a straight path as we continue to expect some July / August volatility, albeit from higher levels.
“Gotta Have Faith!”
(We will be off for Juneteenth on Thursday and resume a week from today on June 24).

1. The S&P 500: A Good Place for a Pause

Source: TradingView. Through year-to-date 2025.
The chart above shows the S&P 500 ETF (ticker: SPY).
Very simply, the S&P 500 is back in the neighborhood of its previous all-time highs.
We are not surprised to see the Index (or ETF) pause at current levels.
Our expectation is that the S&P 500 (and Nasdaq 100) will make new all-time highs, experience a 5-10% correction beginning in mid-July to early August and experience a year-end rally.
We have included a target in the chart above of 645. We view this as a year-end destination “range” (rather than an exact target).
(This is not a recommendation to buy or sell any security and is not investment advice. Past performance is not indicative of future results. Please do your own research and due diligence).
2. Everyone Bearish on the US Dollar

Source: Bank of America. Through year-to-date 2025.
The chart above shows the percent of Fund Managers in Bank of America’s Survey (the “FMS”) that are overweight the US dollar.
Fund managers are the most underweight the dollar that they have been in twenty years.
Typically, when I see positioning or sentiment at such extremes, my reaction is to fade it.
Which brings up the question, why would the dollar rally from here?
Tariff revenues (chart 3, below) have provided some relief to the fiscal deficit. At the margin, the deficit may be less bad than feared.
The Big Beautiful Bill coming out of the Senate reflects more spending discipline than the House bill, and may still stimulate growth.
The Fed has been tighter than many expected this year while other central banks have been easing. Perhaps tomorrow’s announcement will be dollar positive.
Investors left the party too early. Although US equities underperformed at the beginning of the year, just as global investors allocated elsewhere, US equities have come back. Further outperformance will likely attract a return of capital.
Oil price often moves inverse to the dollar.
(Past performance is not indicative of future results. This is not a recommendation to buy or sell any security and is not investment advice. Please do your own due diligence).
3. Tariff Revenues are Up…Will be Offset by the Big Beautiful Bill
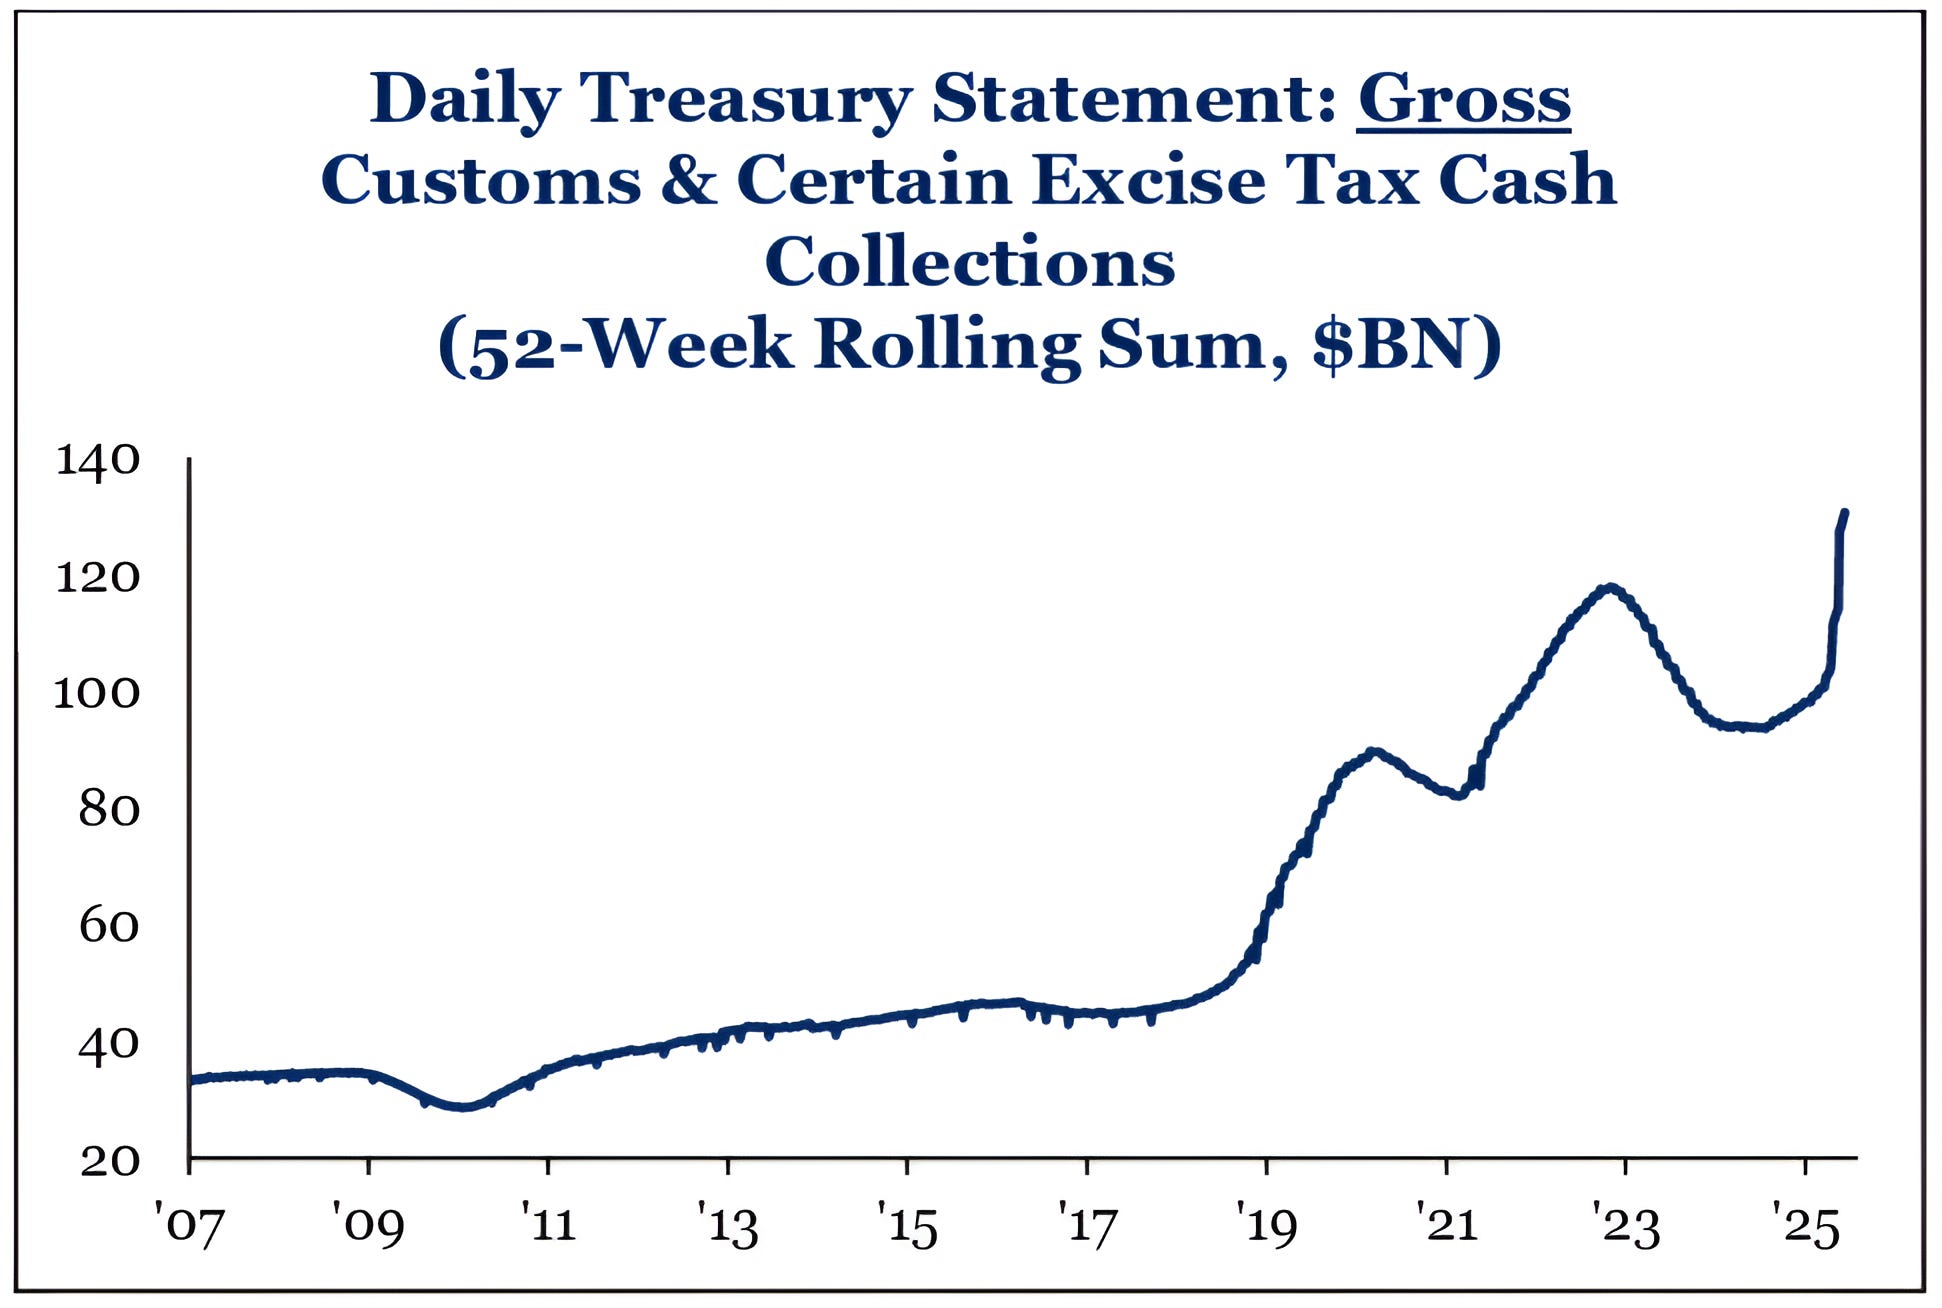
Source: Strategas. Through year-to-date 2025.
The chart above shows the 52-week rolling sum of Gross Customs and certain excise tax cash collections.
Essentially, this chart is capturing the growth in US Tariff Revenues.
As we’ve consistently noted our concern over the US balance sheet and deficit, we should note that the tariffs - which we view as a sales tax - are providing a new source of revenues for the government.
We would also note that based on how negotiations have gone (and seem to be going) the tariffs will likely be partially absorbed by companies (slightly lower margins) and partially absorbed by consumers.
In general, there has not been an across the board inflationary spike due to tariffs.
Pivoting back to the Big Beautiful Bill, as noted in the introduction, it has been revised in the Senate.
According to Dan Clifton at Strategas:
“The topline of the Senate proposal is consistent with the message: make the entire 2017 tax package permanent, including individual and business portions, add the President’s priorities, and raise the debt ceiling. But the underlying details are radically different than the House bill.”
He went on to say:
“Most of the near-term consumer stimulus for early 2026 was removed. Granted, the legislation is a placeholder and will need to be altered to win passage. But time is of the essence. The US economy is slowing, and the tax bill needs to sterilize the tariffs...We have August 27th penciled in for the X date and believe Congress will finish its work by early August. But the Senate just made the process more difficult.”
For those that want the full report from Strategas, please email me.
(Past performance is not indicative of future results. This is not a recommendation to buy or sell any security and is not investment advice. Please do your own research and due diligence).
4. Maybe Current Valuation is Ok…

Source: Barclays. Through year-to-date 2025.
The chart above shows the forward 1-year return +/- 1 standard deviation based on starting price to next 12-months (NTM) earnings ranges. (The analysis excludes period of negative earnings growth).
We have shown that NTM PE doesn’t tell you what will happen in the near-term, but it correlates to what investors should expect over the long-term (chart 4 here, chart 4 here and chart 3 here).
That said - the chart above does an interesting job of capturing the potential returns based on starting valuation along with dispersion of returns.
Interestingly, as price to next 12 months earnings moves from the 20-21x bucket to the 22-23x bucket (as it recently has), historically, the average one year return has been higher and +/- 1 standard deviation dispersion is reduced.
It could be that investors at 22-23x earnings are pricing in substantial future earnings growth.
Regardless, it’s important to note that valuation levels in the 22-23x next 12 months earnings range - while historically associated with an elevated possibility of negative near-term returns - have exhibited a better one-year return profile than lower valuation level buckets.
(Past performance is not indicative of further results. This is not a recommendation to buy or sell any security and is not investment advice. Please do your own due diligence).
5. Is it Time for Global Equities to Outperform?

Source: JP Morgan. Through year-to-date 2025.
The chart above shows the JP Morgan’s long-term (10-15 years) capital market assumptions.
Notably, JP Morgan sees Japanese, European, Chinese and Emerging Markets equities outperforming US.
After 15 years of US equity outperformance (relative to the MSCI All Country World ex-US), we have considered whether there has been a leadership regime shift taking place in global equities.
We believe it is too early to make that call.
We would also note that JP Morgan sees 5.5% annual returns in US equities over the next 10-15 years. This is somewhat consistent with the correlation between today’s valuation and long-term expected returns.
We will be off for Juneteenth. Have a great weekend - we will be back next week!
(Past performance is not indicative of future results. This is not a recommendation to buy or sell any security and is not investment advice. Please do your own research and due diligence).