


Sledgehammer!
Trump's Liberation Day tariffs were worse than many expected. As the market digests the news, it's important to understand what was proposed, why and the economic and earnings impact. Let's dig in...

Obviously, the news from “Liberation Day” - the announcement of the Trump tariffs - was much worse than expected.
While the details were unexpected, the announcement, in general, was consistent with the part of the Trump agenda known as the Mar-a-Lago accord.
What is the Mar-a-Lago accord?
The framework of the Mar-a-Lago accord was written by Steven Miran, the Chair of the Council of Economic Advisors and a senior strategist at Hudson Bay Capital. (Here is a link: “A User’s Guide to Restructuring the Global Trading System.”)
Simply put, the Mar-a-Lago accord is a grand economic bargain policy framework to use US economic and military (removal of defense support agreements) to bring countries to the negotiating table with the primary objective of weakening the dollar (see chart 3) with the ultimate goals of:
Reviving US manufacturing (on-shoring);
Shrinking the US debt;
Reducing the US fiscal deficit;
Lowering US interest rates (see chart 2).
Chaos, in this framework, is a feature not a bug.
Chaos, unpredictability and the willingness of the US to “crash” the global economy, in the view of Trump and his advisors, will lead countries to make concessions to for the US to achieve these core objectives.
What is the key policy measure to achieve this objective? Tariffs.
The tariffs were supposed to be reciprocal, but the Trump administration did not reciprocate against actual tariffs, it established a calculation of “assumed” tariffs.
The calculation for each country’s “assumed” tariff is: the US trade deficit with a country divided by the country's exports to the US.
As an example:
the US has a $17.9 billion trade deficit with Indonesia.
Indonesia’s exports to the US are $28 billion.
So the “assumed” tariff that Indonesia placing on US goods is $17.9/$28 = 64%.
The reciprocal tariff under the Liberation day policy (based on what I can tell) is the greater of 1/2 of the “assumed” tariff or 10%.
In the case of Indonesia, the US tariff on Indonesian goods (announced yesterday) will be 32%.
While I’ve used Indonesia as an example, the most direct US equity / market implications likely come from Vietnam, Taiwan and China.
Simply considering Vietnam, the reciprocal tariff is 46%.
Since the last round of Trump tariffs - many manufacturers that had existing supply chains in China, moved to Vietnam.
Companies, such as Restoration Hardware, Nike and Lululemon will need to either increase prices or reduce margins.
Taken much more broadly - companies and analysts, in general, are likely to significantly reduce S&P 500 profit expectations for the rest of 2025 and 2026 when earnings season begins next week.
We have often said, that it is ok for air to slowly leak out of the profit balloon (as it has been doing), but the markets often cannot handle a significant simultaneous reduction in expectations (pop the profit balloon).
The reciprocal tariffs, based on an estimate from Strategas (the best independent research house, imo) equal about $620 billion. (see chart 4).
While this would be a massive fiscal tightening, if it is accurate, it would also provide broad scope for a massive US tax cut that would include an extension of Trump’s 2017 Tax Cuts and Jobs Act as well as additional corporate and personal tax reductions.
The challenge (at least one of the challenges) that we have been citing for some time has been the timing and transition from policies that lead to slowing growth and uncertainty (DOGE, Tariffs, etc.) to pro-growth policies such as tax cuts.
The policy hand-off from Biden to Trump and specifically Treasury Secretary Yellen to Treasury Secretary Bessent has been a theme and focus of ours this year.
As we have highlighted, the Trump administration is content with crashing dramatically slowing the economy, blaming it on Biden and then taking credit for its recovery (due to tax cuts and stimulus). (We highlighted this in the introduction here).
Needless to say, even if the policy were perfect (it is not), this would be an 11 out of 10 on the difficulty scale.
Although it somehow feels irrelevant, it’s important to note that tomorrow the US will release its March employment report.
In our view, a disappointing employment report (fewer jobs added etc.) could accelerate expectations for Fed easing and offset some of today’s (in)digestion from the tariff announcement.
Thinking back to earnings:
As stated above earnings expectations will come down likely more than we expected.
However, when earnings expectations are dramatically reduced, we also need to consider what valuation multiple the market deserves.
Simply considering $300 in S&P 500 earnings for 2026 (FactSet bottoms-up estimates are currently $308), do these deserve a 20x multiple (6000), an 18x multiple (5400) or the long-term average multiple 16.5x (4950)?
Over the past 10 years, on corrections, S&P 500 valuation has bottomed at around 15x earnings (4500)? (See chart 3 here).
What if earnings expectations are lower?
Finally, it should be said that this market action has been somewhat predictable. We have been expecting this since last June.
Maybe not the catalyst, but the market action.
We have been highlighting the increasing likelihood of a sell-off consistently (including on Tuesday here as well as an evolution of our thinking here) and updating our more cautious positioning.
(As an aside, we expect a crowd of Wall Street Strategists to change their targets as Goldman recently did and to blame the revision on the tariffs.
This is not the reason their bullish targets for 2025 will not be met.
When we presented them - we explained that they were, in our view, unrealistic overly optimistic. (see chart 3 here and here)
As a reminder BCA - chart 3 here - called for a recession this year, but seems to have (also) missed the catalyst. Let’s see if their S&P 500 target 4450 is accurate).
In our view, this has been a bubble in search of a pin. Instead, Trump hit the bubble with a…
Sledgehammer!
(Several people have contacted me with questions, further details on policy and allocation suggestions, I am happy to help).

1. The Nasdaq 100: Is a Sell-Off to the November 2021 High Possible?
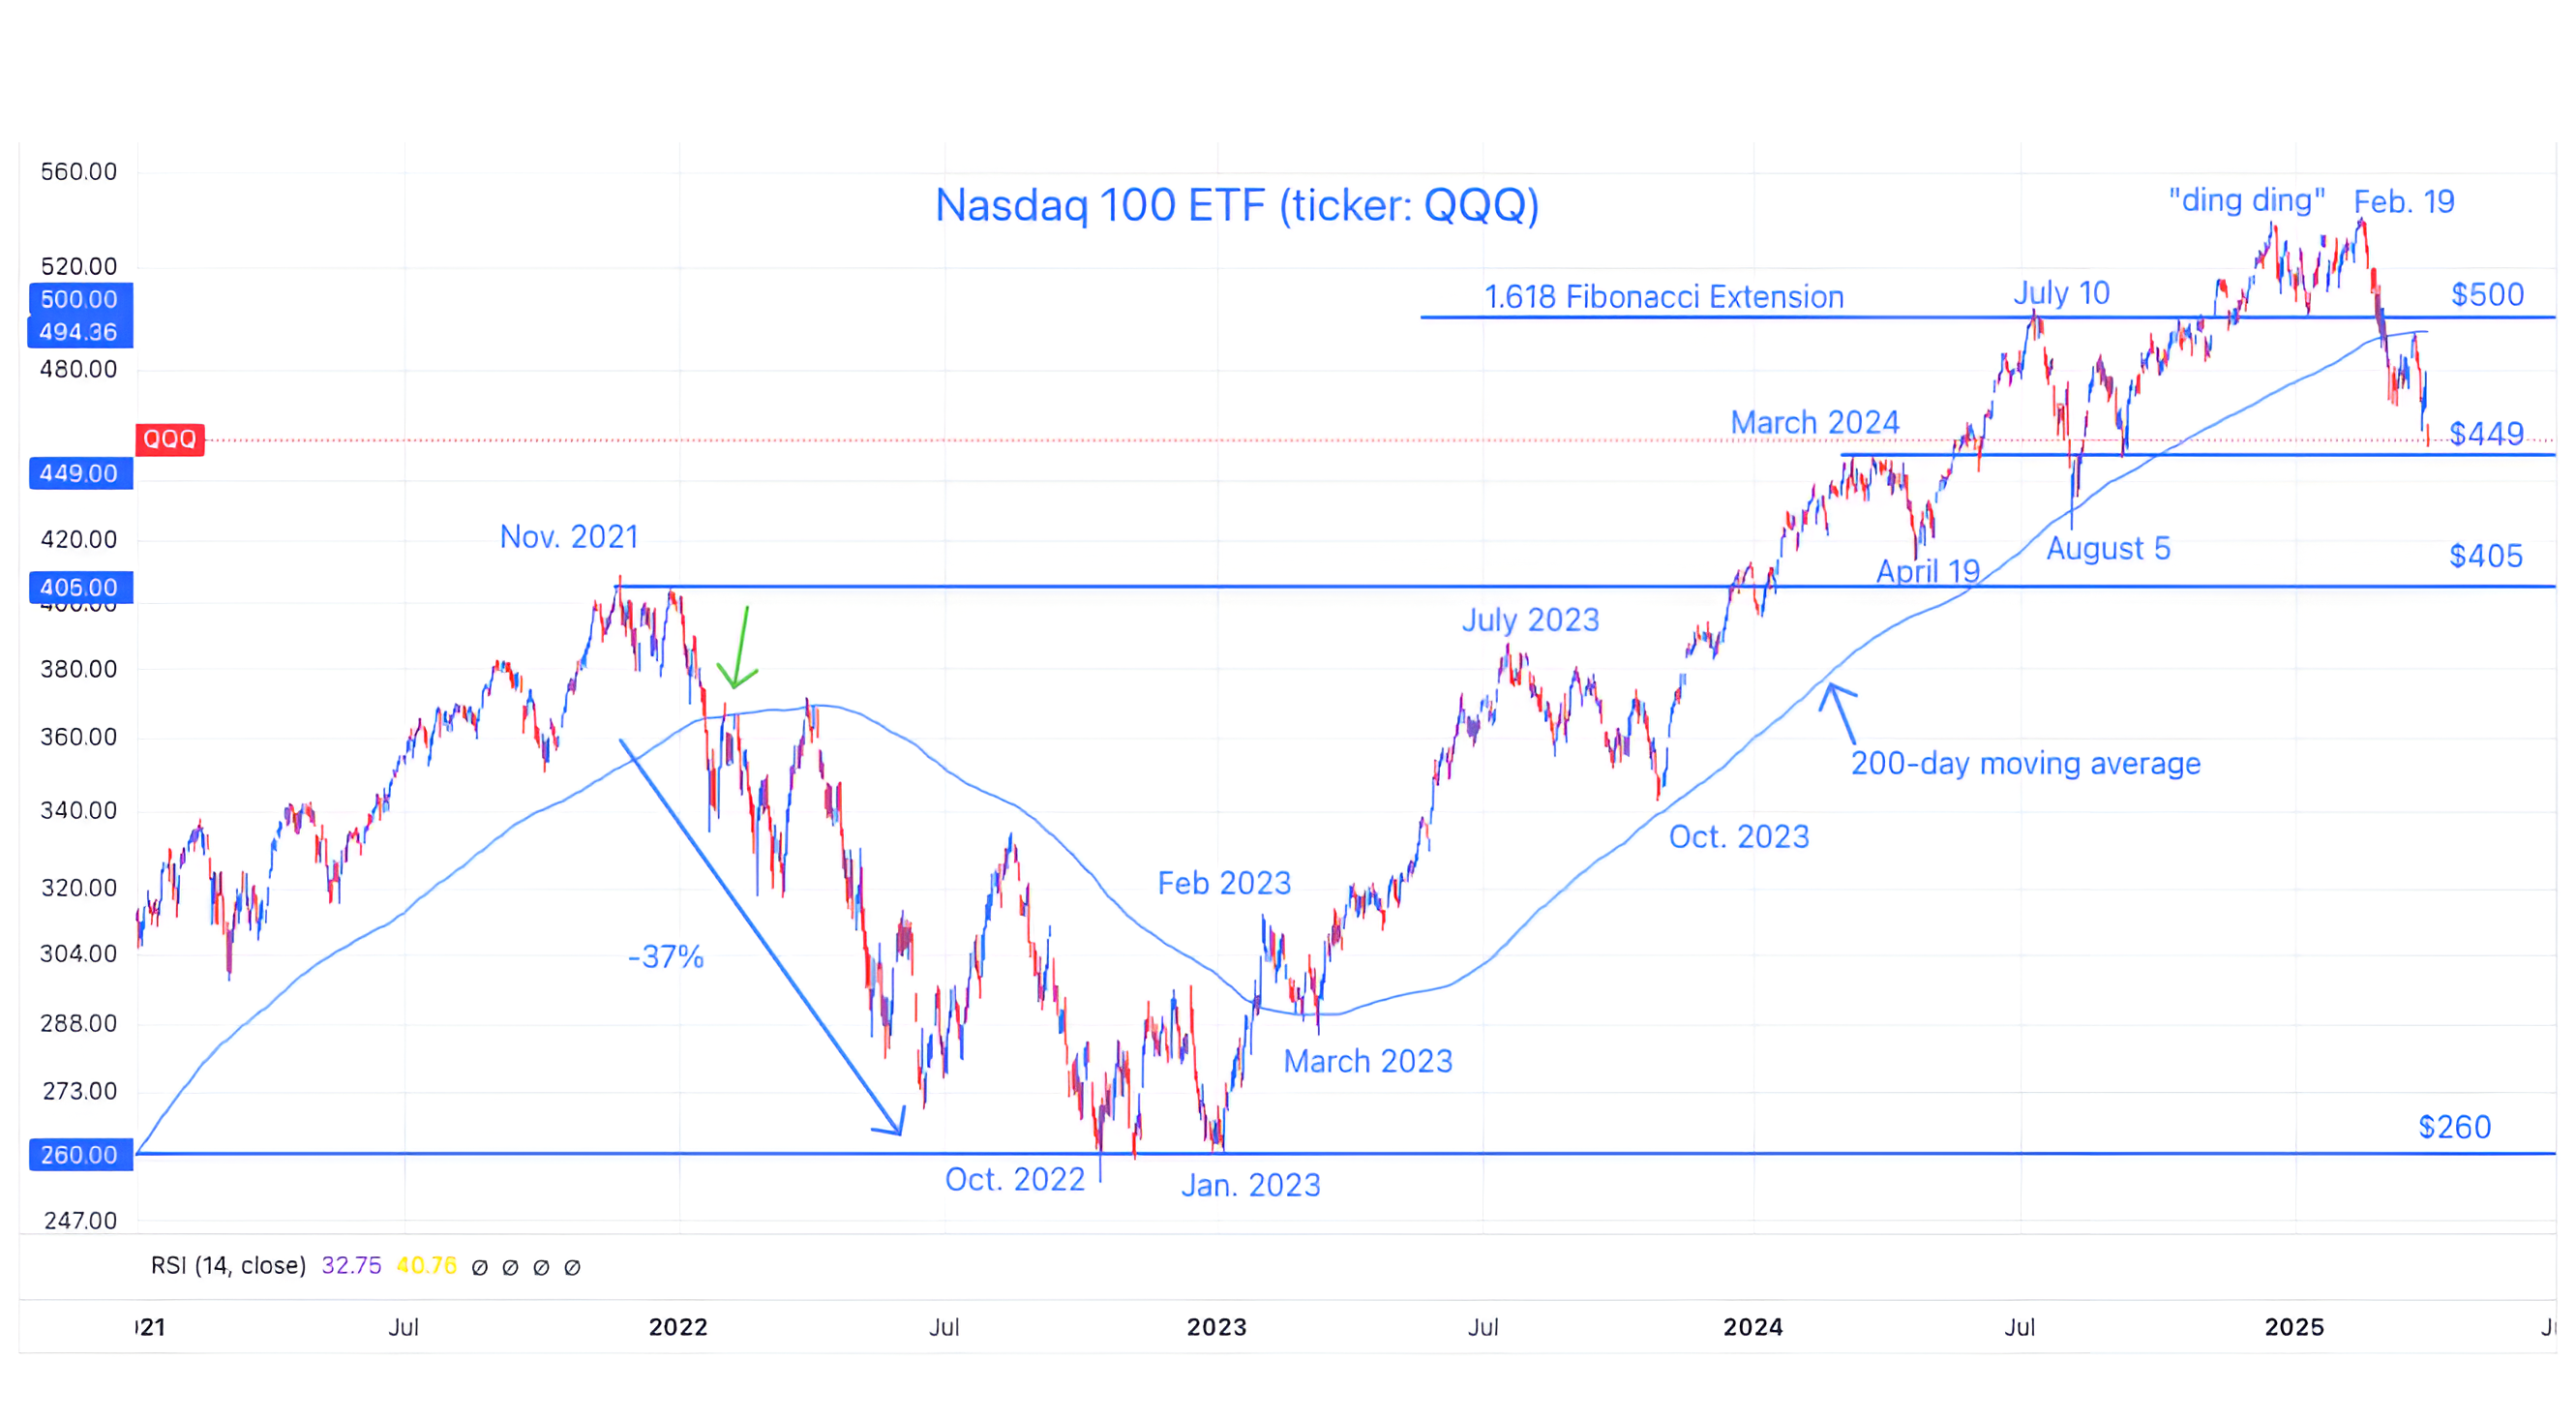
Source: TradingView. Through year-to-date 2025.
The chart above shows the Nasdaq 100 with its 200-day moving average (curved light blue line).
Over the past couple of weeks, we have highlighted the 200-day moving average (nothing good happens beneath it) and questioned whether a bounce back to it would be met with further selling like in 2022 (green arrow) or with a further recovery.
While the move back to the 200-day moving average was met with further selling, the Nasdaq 100 is now near a level - the March 2024 high (we’ve basically only erased a year of gains) - which has been a floor in the past.
As a result - we wouldn’t be surprised to see a bounce from current levels - particularly if tomorrow’s employment number is weak. If that is the case, investors expectations of Fed easing may increase and lead to a rally (we’ll see).
Although it’s possible for the Nasdaq 100 to move back to its 200-day moving average again (as it did in early 2022), we see this as unlikely.
We believe that with earnings season coming (along with the continued economic uncertainty), there is 60-70% chance that the Nasdaq 100 will fall through its March 2024 high and towards it November 2021 high.
If that were to occur, it would represent a 25% drop from where we rang the bell (“ding ding”) in early December.
(This is not a recommendation to buy or sell any security and is not investment advice. Past performance is not indicative of future results. Please do your own research and due diligence).
2. Objective 1: Lower Treasury Yields
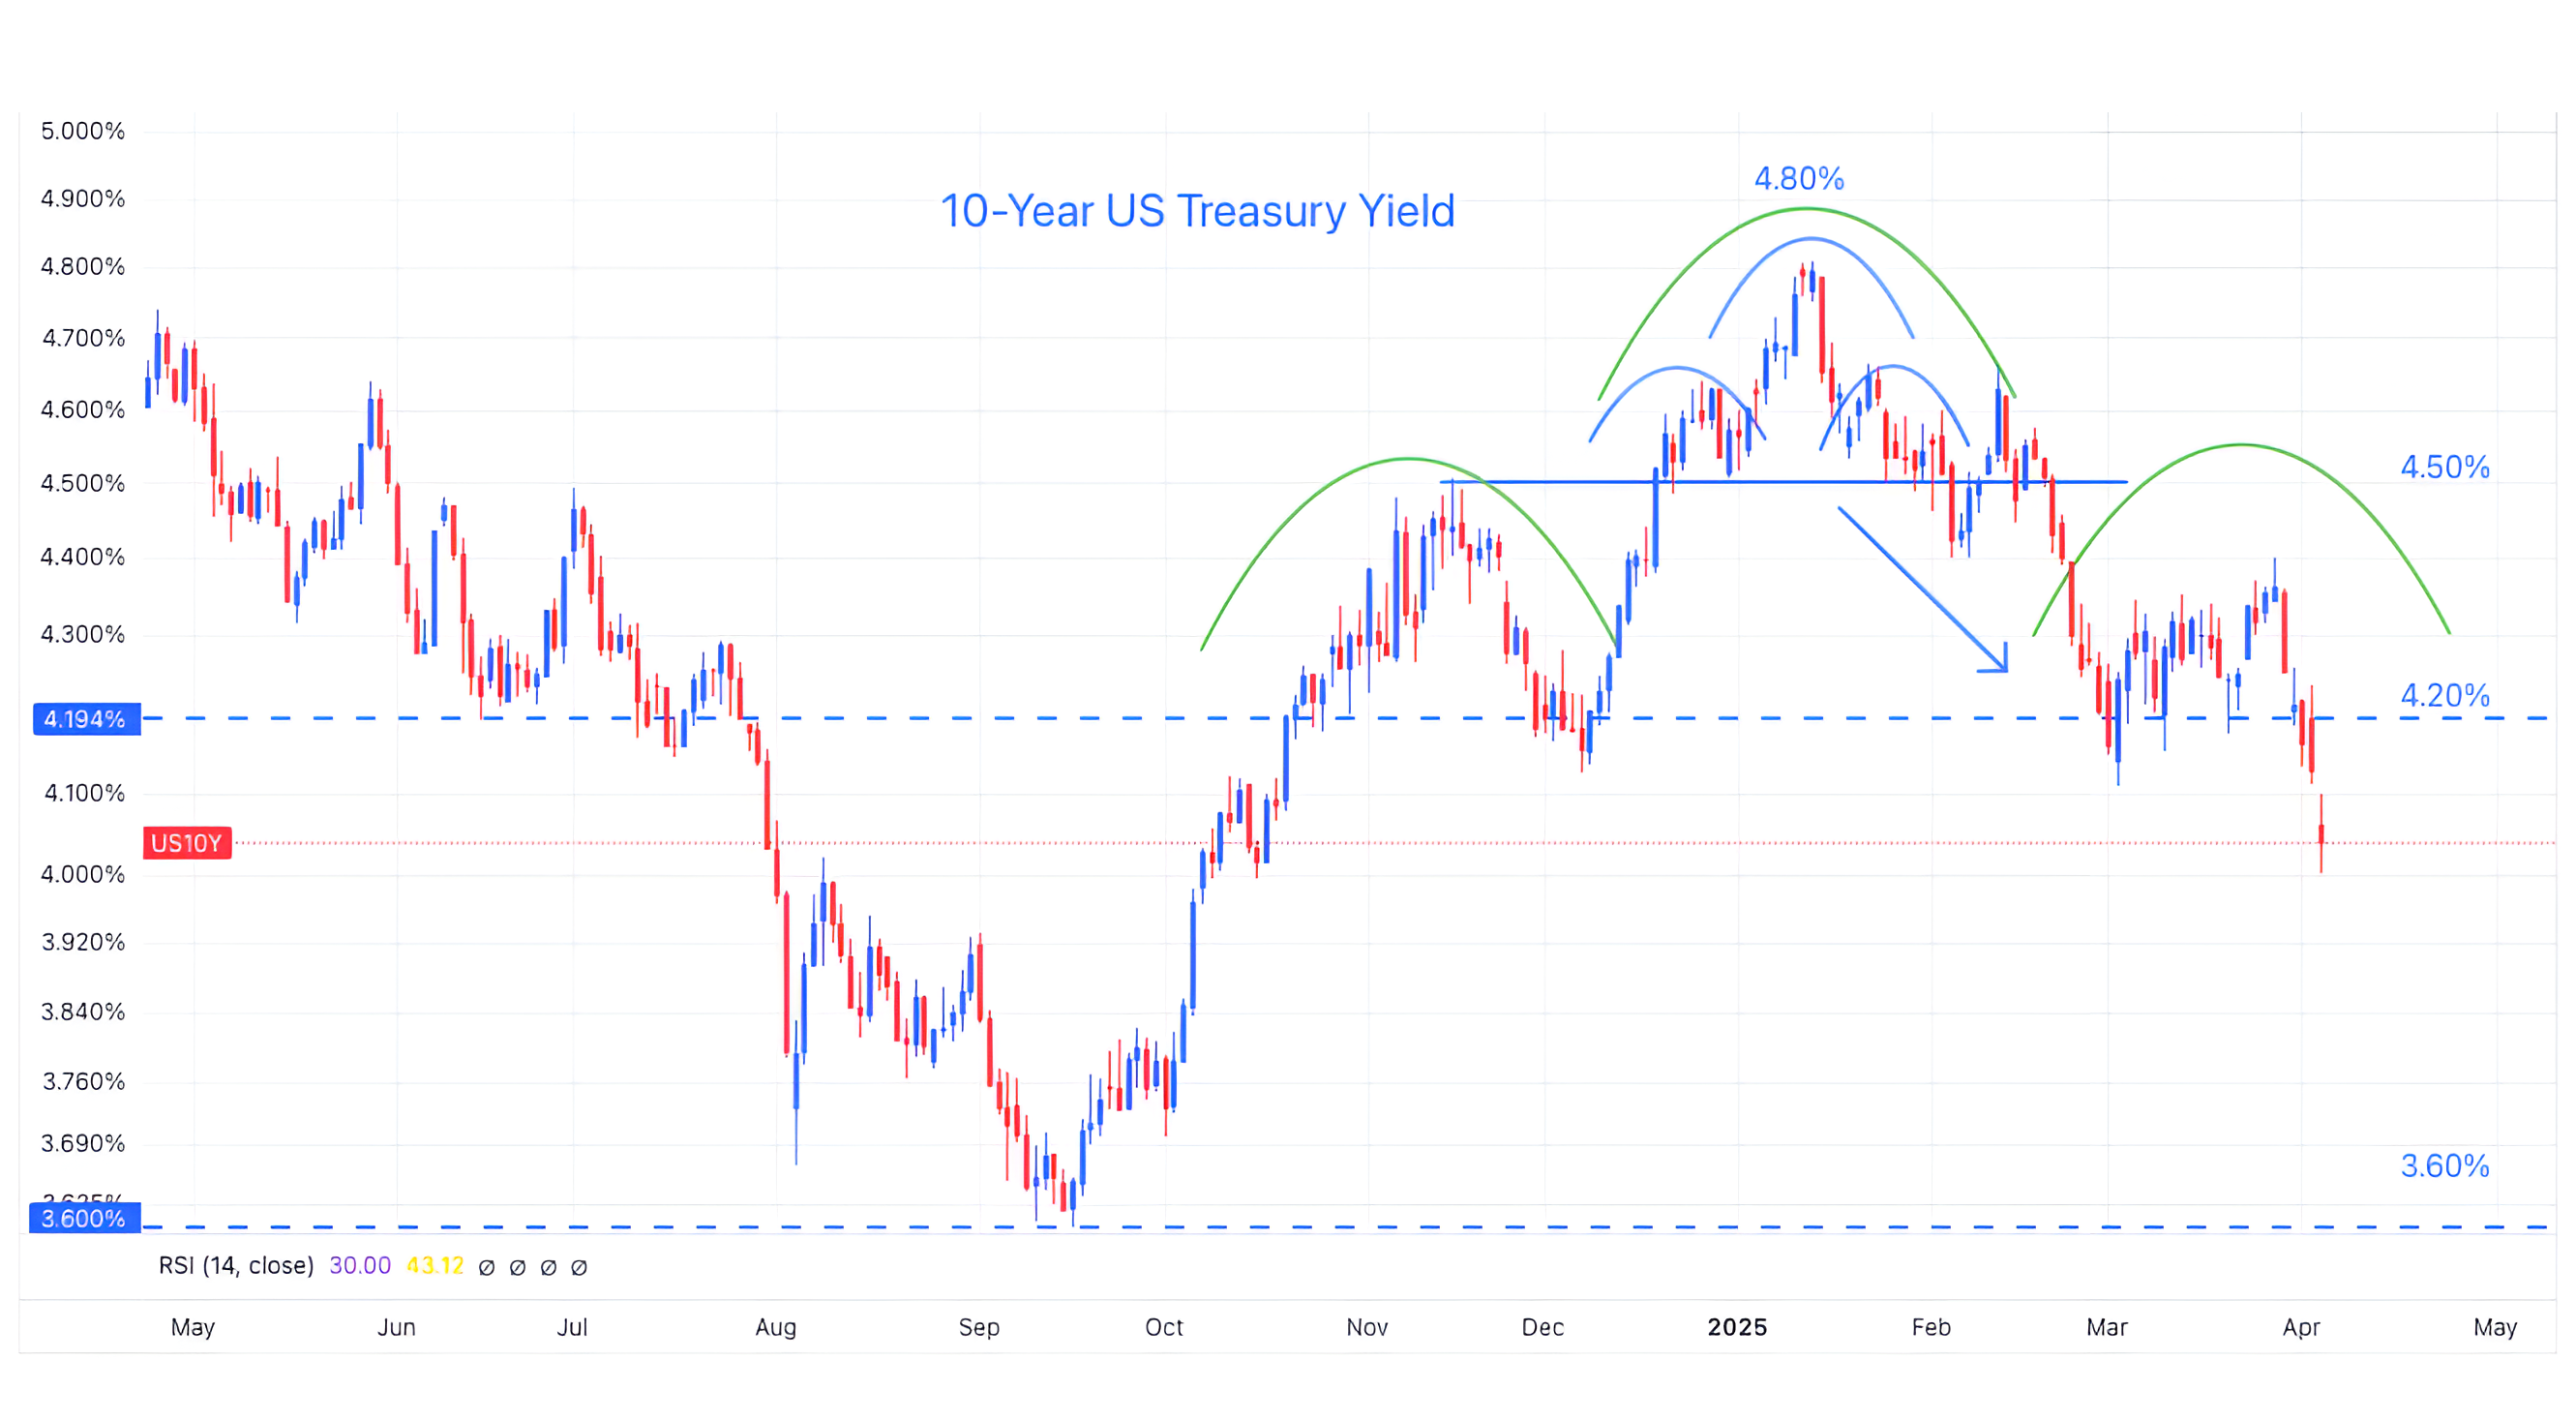
Source: TradingView. Through year-to-date 2025.
The chart above shows a short-term view of 10-Year US Treasury Yields.
We last showed this chart three weeks ago (chart 4 here).
At the time, we wrote:
“It seems as if a larger head and shoulders may be forming (the three green arcs).
If the larger (green arc) head and shoulders pattern were to fully develop, it would suggest:
a move higher in 10-Year US Treasury Yields from a current level of 4.30% back up to the neighborhood of 4.50%;
a drop back down to 4.20% (the neckline of the large head and shoulders);
a possible battle (?) at the 4.20% area; and,
if the pattern fully develops - a final move to 3.60%.”
Over the past three weeks, 10-Year US Treasury yields moved back up to 4.40% and have now fallen through the neckline at 4.20%.
While Yields may bounce and “re-test” the neckline from the south, in our view US Treasury yields are likely headed to 3.60%. (In other words, buy at 4.10-4.20 if you can).
As we wrote when we last showed the chart and reiterated in the today’s introduction:
“Remember, lower yields may be a goal of the current administration.
As we showed in chart 4 here the US has $36 trillion of debt outstanding with an average interest expense of 3.4%. Half of that debt needs to be refinanced between 2025 and 2027.
Interest expense is already a larger US budget item than defense spending (see chart 3 here).”
(Past performance is not indicative of future results. This is not a recommendation to buy or sell any security and is not investment advice. Please do your own due diligence).
3. Objective 2: Weaken the US Dollar

Source: TradingView. Through year-to-date 2025.
The chart above shows the US Dollar Index (DXY).
We last showed the US Dollar a month ago in chart 3 here.
With the green arrows on the chart, we are trying to show that over the past two years, the dollar has experienced similar downward moves.
We believe the real battle for the current move lower will be at the 2023-2024 floor (lowest horizontal line at the $100.50 level).
Often when we write about the Dollar, we note that since 2022 large moves in the US Dollar have generally been inverse to equity market performance.
In other words, US Dollar strength has often been consistent with equity weakness and vice versa.
The inverse relationship between the strength / weakness of the US dollar and US equities broke in Q4 2024.
As the dollar strengthened from September 27 to January 15, the S&P 500 moved higher by 6%. Similarly, during the current period, the weak dollar has not provided equity market support.
At some point, the weak dollar will be helpful for corporate earnings and equities, however, it seems that there are a number of issues to resolve before we arrive at that point.
(Past performance is not indicative of future results. This is not a recommendation to buy or sell any security and is not investment advice. Please do your own research and due diligence).
4. Will Tax Cuts Offset Tariffs (at Some Point)?
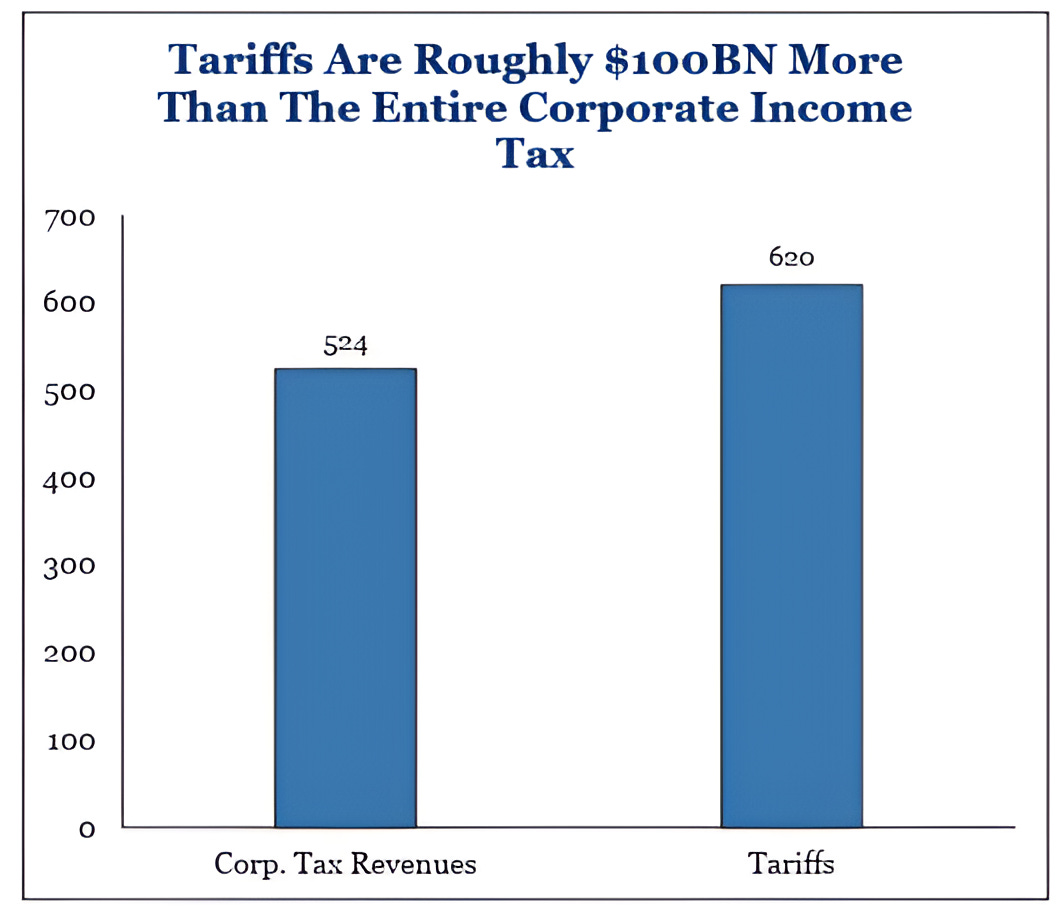
Source: Strategas. Through year-to-date 2025.
The chart above shows Strategas’ (the best independent financial, economic and political research firm, imo) estimates of US Corporate tax revenues and possible tariff income given yesterday’s announcement.
While these estimates are fluid and I have seen some say that the tariffs are larger, this is simply to show the possibility (and likely goal) of tax cuts being offset by the tariffs.
The challenge as we have continued to highlight is the transition from the slower growth policies that will impact the economy immediately and the pro-growth policies, that have not been officially announced, approved or enacted. The Brits might say, “mind the gap.”
(Past performance is not indicative of further results. This is not a recommendation to buy or sell any security and is not investment advice. Please do your own due diligence).
5. Watching Chinese Internet Shares for a Bounce

Source: Source: TradingView. Through year-to-date 2025. Through year-to-date 2025.
The chart above shows the Chinese Internet ETF (ticker: KWEB).
We’ve been highlighting this chart for some time (we last showed the chart here).
Chinese Internet shares rallied to October 4 last year as China issued a range of stimulus measures.
They then fell in anticipation of Trump’s re-election.
They rallied once again with the announcement of DeepSeek and have now come back to a level that has acted as both a floor and a ceiling.
In the midst of the tariff-storm, if Chinese Internet shares are able to bounce from here, it might be an interesting buying opportunity.
(We wanted to end today on a constructive note).
(Past performance is not indicative of future results. This is not a recommendation to buy or sell any security and is not investment advice. Please do your own research and due diligence).