


Something's Gotta Give...
When markets sit at key levels for extended periods, it's as if they're waiting to make a significant move in one direction or the other. We don't know the catalyst or the direction. Let's dig in...

As we have written several times, one of our strongest market philosophies is based on the wisdom of Stanley Druckenmiller:
“Earnings don’t move the overall market; it’s the Federal Reserve Board… focus on the central banks and focus on the movement of liquidity… most people in the market are looking for earnings and conventional measures. It’s liquidity that moves markets.”
Liquidity, in our view, is the key.
We have written several times about “stealth liquidity” (see here, here, here, here, here, here, here, chart 4 here and here).
One of the characteristics that we believed would make 2025 complex is the changing people and priorities in the US Presidential Administration.
While Treasury Secretary Scott Bessent praised the Fed’s recent decision to hold rates steady, we don’t know if he will offset the Fed’s pause with the stealth liquidity measures (the Treasury General Account, Reverse Repos and funding the Government with short-term debt) that former Treasury Secretary Yellen used.
In addition, we our concerned that rate cuts have nearly been eliminated from 2025 projections and with any scent of inflation (see chart 4) market may fear a tightening bias.
In our view, it is critical to remember November 2021.
It was simply the hint that the Fed would accelerate the end of quantitative easing (in Q1 2022) (which would in turn set the stage for the rate hike cycle) that halted the ascent in equities.
To counter that, the work that the Department of Government Efficiency (DOGE) is doing to quickly reduce Government spending (opinions about where the cuts are coming from aside), may be disinflationary.
In other words, markets are entering 2025 with a backdrop of exceptionally complicated cross currents and new personalities.
We will do our best to parse through it and prioritize what we believe are the most important indicators and signposts.
While the piece below reflects caution and we have reduced exposure to equities by 10-15% across portfolios this year (unlike 2024, when we remained invested, but hedged), we are open-minded and are watching the charts to confirm direction.

1. The S&P 500: Exhausted or Ready to Launch?

Source: TradingView. Through year-to-date 2025.
The chart above shows the S&P 500 since 2021.
After trading in a broad range (1150 points) from early 2021 to early 2024, the S&P 500 moved above the range and to the 1.618 Fibonacci extension of its 2022 sell-off.
(As an aside, I want to apologize to those that don’t like my use of Fibonacci levels. I will use any approach to the market to provide insight and an “edge.” It is clear, across charts, that these Fibonacci extensions have been meaningful and significant. I can’t tell you why, but I will continue to show them as long as they’re useful.)
Having moved above the 1.618 Fibonacci extension level, the S&P 500 is now contending with its “symmetrical upside” (another key level that we are seeing across indexes).
We have described symmetrical moves in the past - often, after moving above a sideways range, the upside objective becomes a “symmetrical” move higher.
With the S&P 500, as shown on the chart, the sideways range was 1150 points and once the index moved above the range, the upside objective became 1150 above the top of the range.
Now that the symmetrical objective has been achieved and the S&P 500 has been in its orbit for three months - what will the resolution be?
Our view is that from these levels, over the near-term, the risk / reward is not favorable (this is why we reduced exposure).
While we could justify a 5% move higher, it is hard for us to envision 10% near-term upside, particularly as 2025 earnings expectations are being reduced (see chart 2, below).
On the other hand, a 10-20% correction is a reasonable possibility.
While we have shown the possibility of a 10-20% correction based on valuation - most recently chart 3 here where we wrote, “If the Median Price to Earnings were to revisit the average line from current levels, all else equal, this would represent a 17% decline” - it can also be justified based on market history.
From October 2022 to October 2024, the S&P 500 gained 65%.
Over the past 40 years, the S&P 500 has gained 60%+ over a two-year period only six times (1985-1987; 1996-1998; 1998-2000; 2009-2011; 2020-2021 and 2022-2024).
Each of the times has ended with a 20%+ correction.
With the exception of the 1998 sell-off which has been blamed on a combination of the Russian Default Crisis and Long-Term Capital Management, the proximate cause for the other sell-offs was increasing inflation and resulting expectation (and reality) of tighter monetary policy.
We will see if this time is different.
(This is not a recommendation to buy or sell any security and is not investment advice. Past performance is not indicative of future results. Please do your own research and due diligence).
2. An Earnings Season Update

Source: FactSet, Luminos Advisors. Through year-to-date 2025.
The chart above shows the quarterly S&P 500 earnings expectations from Q4 2024 to Q4 2025 on December 13 (just before the end of Q4 2024) and as of February 7 (with 62% of the S&P 500 companies having reported).
While Q4 2024 S&P 500 earnings have been better than expected, Q1 2025 has been meaningfully (-3.3%) guided down.
Overall, Q4 will be a record earnings quarter for S&P 500 earnings ($64.15) and is currently estimated to grow 15.5% which is better than we expected.
Looking at expectations for Q1 2025 earnings, in mid-December, earnings were expected to grow 12.1%, they are now expected to grow 8.5%.
Overall 2025 S&P 500 earnings expectations have declined 1.0% since December 13 and 2.9% from their early September 2024 peak.
While the index can navigate an environment where earnings expectations are slowly reduced, it does put some pressure on valuation.
In other words, at today’s S&P 500 level of approximately 6050, based on the early September estimate of 2025 earnings ($279.50) the S&P 500 would be trading at 21.6x 2025 earnings rather than 22.3x based on current 2025 expected earnings of $271.42.
This is nearly a multiple point of difference simply based on the lowered earnings expectations. Given the valuation level, further negative earnings revisions that push the valuation multiple higher could constrain S&P 500 upside.
(Past performance is not indicative of further results. This is not a recommendation to buy or sell any security and is not investment advice. Please do your own due diligence).
3. GS Bull / Bear Indicator Signals Caution…

Source: Goldman Sachs. Through year-to-date 2025.
The chart above shows the Goldman Sachs Bull / Bear market indicator (dark blue line) and World Bear Markets (periods of significant global equity drawdowns - light blue shaded areas).
The Goldman Sachs Bull / Bear market indicator is based on six factors that, when present simultaneously, have preceded bear markets:
high stock valuations;
a flat yield curve;
strong manufacturing activity;
excessive private sector spending;
rising core inflation; and
exceptionally low unemployment rate.
It might look at these characteristics and say these are mostly seem like good things.
However, the combination of elevated equity valuations and the flat yield curve vs. the inflationary dynamics of already rising core inflation and wage pressures caused by low unemployment, high spending and strong activity is a challenging recipe.
What this says to me is that we need to be acutely aware of any inflationary dynamics.
(Past performance is not indicative of future results. This is not a recommendation to buy or sell any security and is not investment advice. Please do your own due diligence).
4. A Look at Inflation…

Source: The Federal Reserve Bank of Cleveland . Through year-to-date 2025.
The chart above shows the Federal Reserve Bank of Cleveland’s Inflation Nowcast for the personal consumption expenditures (PCE), the consumer price index (CPI) and their respective core measures.
The Cleveland Fed has a great site dedicated to inflation nowcasting here that provides daily “nowcasts” of inflation
The Cleveland Fed’s nowcasts are estimates of the current period's rate of inflation based on a model that uses a small number of high frequency data series including daily oil prices and weekly gasoline prices, and monthly CPI and PCE inflation readings.
While the Cleveland Fed is currently estimating that the year-over-year CPI and PCE inflation measures will be lower in February than January, on a month over month basis, the nowcast is picking up a slight acceleration in inflation, particularly on the headline (non-core) measures.
These readings are still early and do not warrant any tightening.
However, as we referenced in chart 4 here (an important chart):
“According to Don Rissmiller, the Chief Economist as Strategas, once an economy sees a wave of inflation over 6%, historically, across different economies, the occurrence of a second wave over 6% has been about 85%.”
If inflation were to pick up, this would likely be met by a negative equity market reaction.
(Past performance is not indicative of future results. This is not a recommendation to buy or sell any security and is not investment advice. Please do your own research and due diligence).
5. Is Gold Pricing in Inflation or Uncertainty?
Source: TradingView. Through year-to-date 2025.
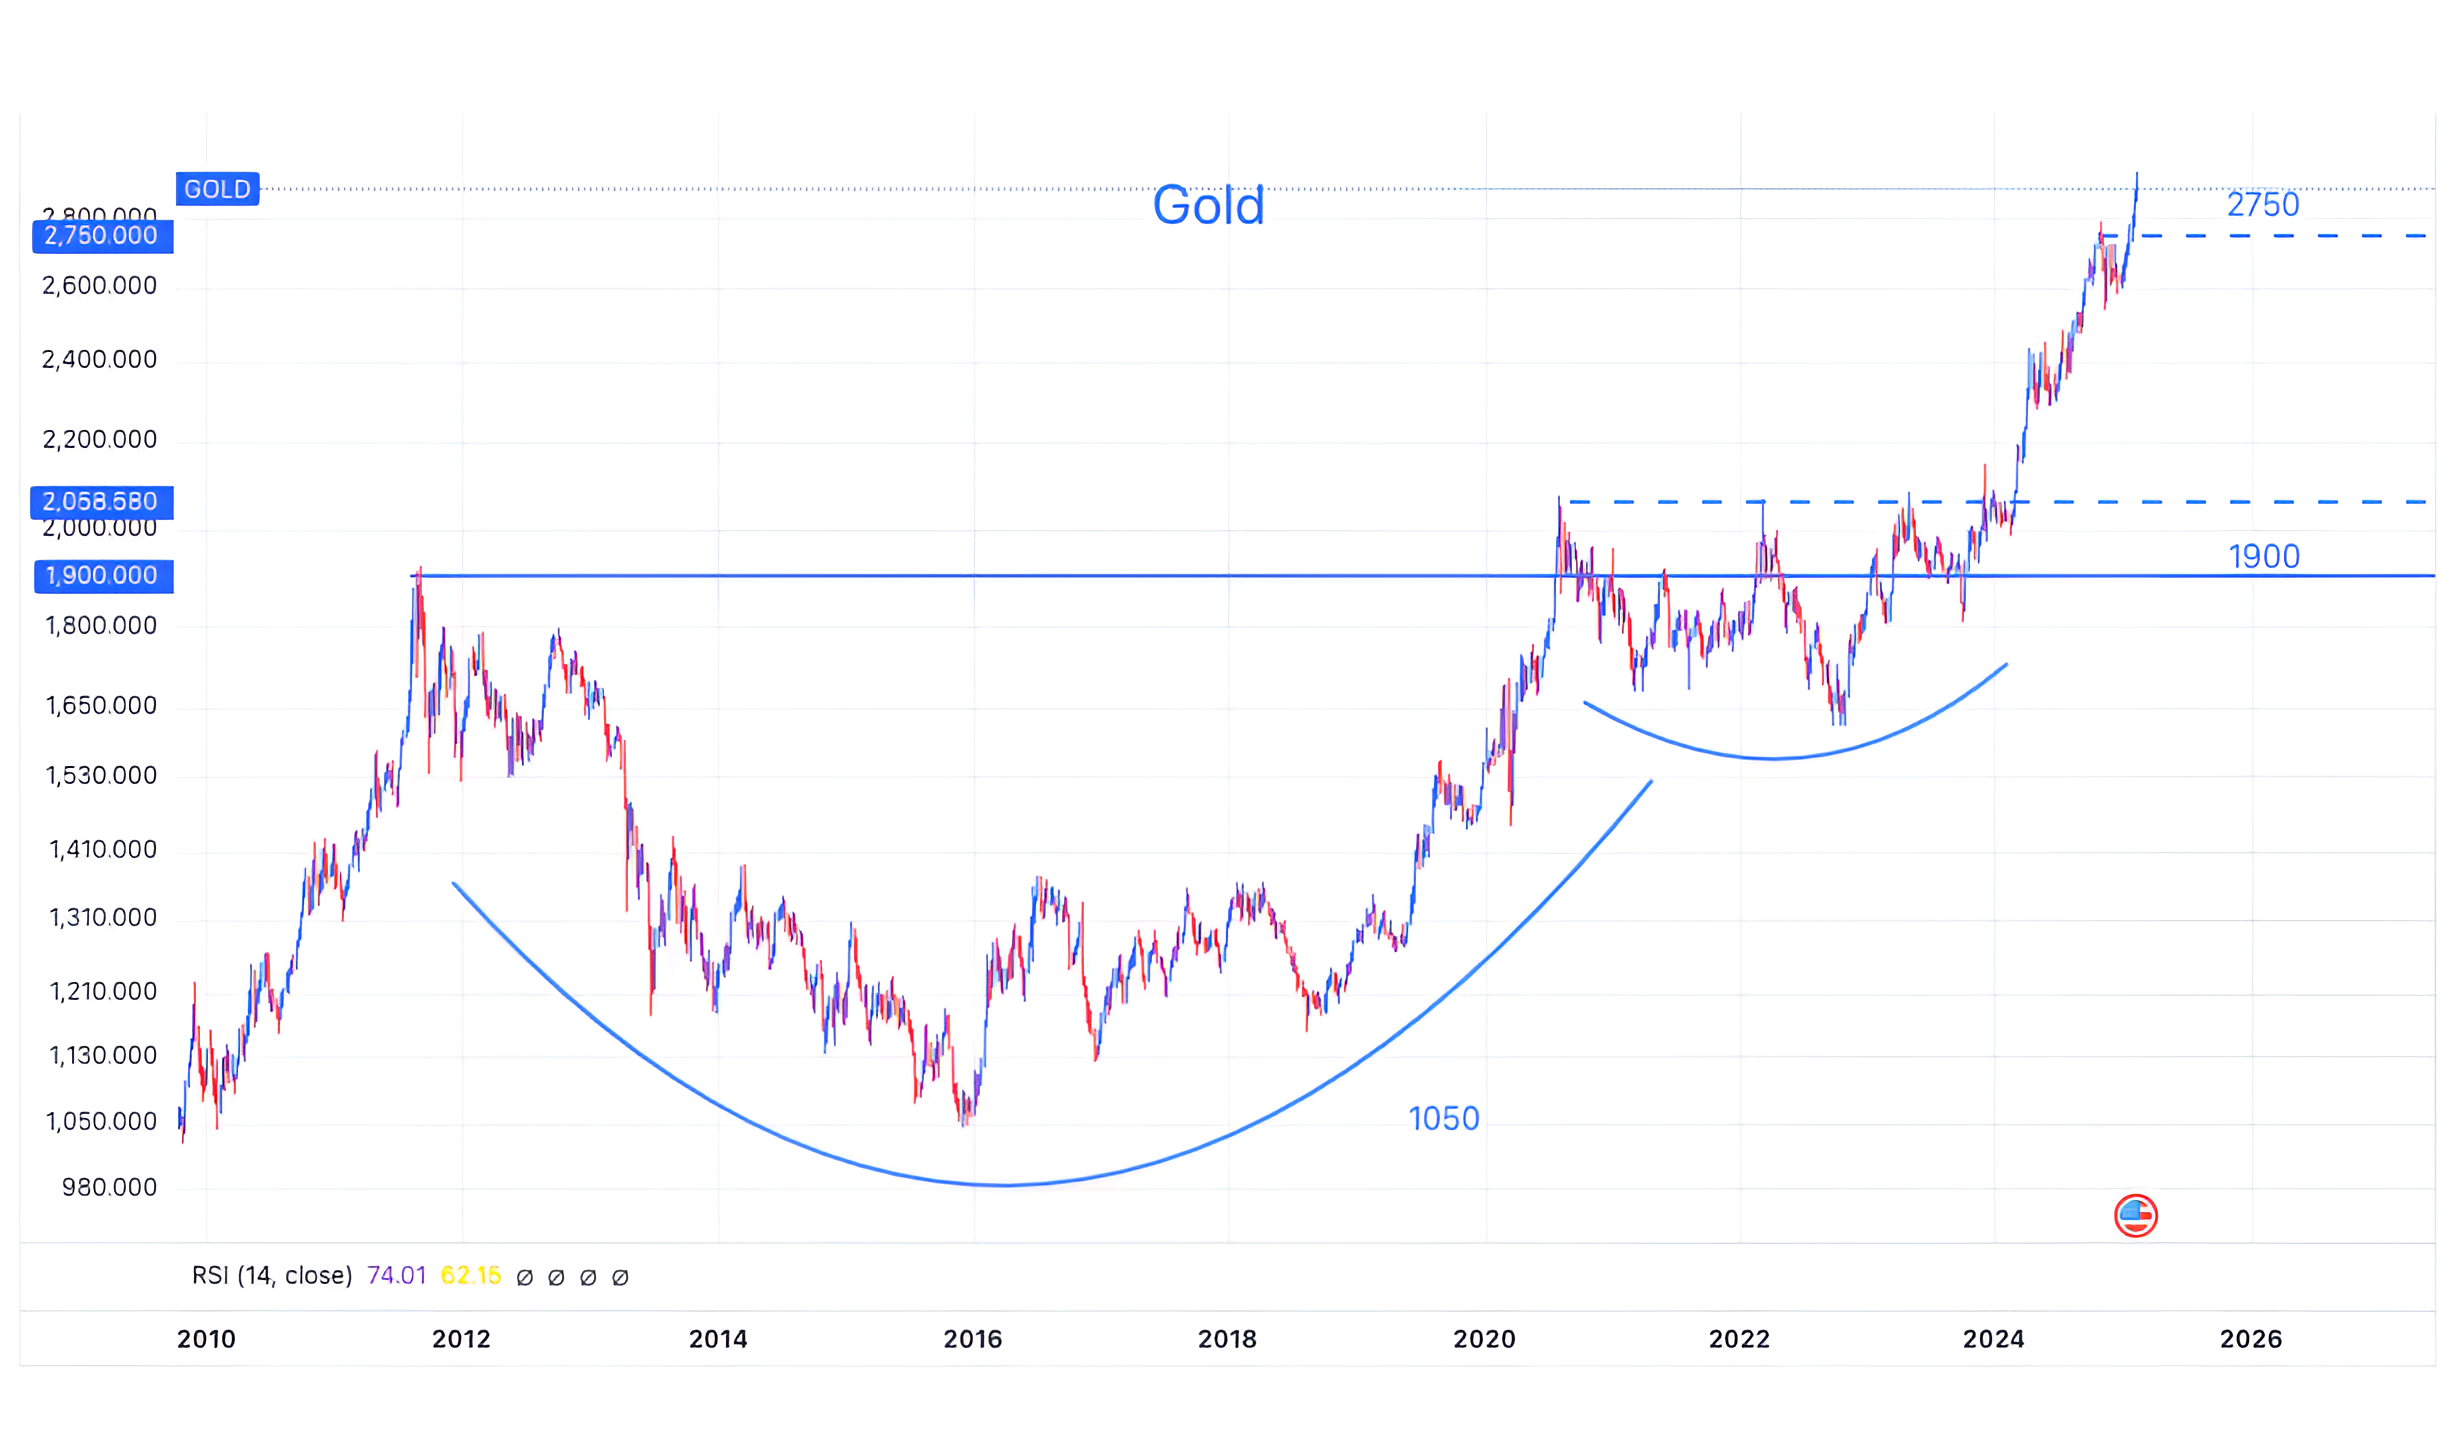
The chart above shows the price of Gold ($/ounce).
Although we have often referred to it as an uncertainty hedge, Gold is most broadly seen as an inflation hedge.
When we last showed Gold (chart 3 here), we presented it with a liquidity indicator based on the Treasury’s stealth liquidity tools (the Balance Sheet, General Account and Reverse Repos) and showed that Gold led stealth liquidity by a year.
Prior to that, we showed Gold in mid-August (here) where we highlighted our 2750 target based on the “cup and handle” formation that we’ve drawn on the chart.
At the time, we wrote: “Typically these patterns are symmetric in that the upside target, once the rim of the cup is surpassed, is equal to the distance from the rim of the cup (1900) to the bottom of the cup (1050).
In the chart above, the upside objective is 2750 (1900+(1900-1050)). This would be 12% higher than today’s level.”
Now that Gold has achieved that objective, we would not be surprised to see a pause, however, the key here, and why we are showing the chart, is to consider whether Gold is pricing in future inflation.
(Past performance is not indicative of future results. This is not a recommendation to buy or sell any security and is not investment advice. Please do your own research and due diligence).