


Doctor! Doctor! Can't You See I'm Burning Burning?
While the news remains complicated, we remain conservatively positioned and aware of risks and further downside. However, we want to consider what could go right and be ready to act. Let's dig in...

In my view, there have been three key events that shaped the character of markets in 2025:
The DeepSeek Announcement.
While our focus last year was on the “stealth liquidity” that Treasury Secretary Yellen was applying to the economy, we also acknowledged the economic support from US fiscal stimulus and hyper-scaler spending.
(For a summary of these views, see the introduction here; for “stealth stimulus,” see last Thursday’s introduction, here; for the fiscal deficit, see chart 4, here; and for hyper scaler spending, see see chart 4, here).
While the announcement of DeepSeek, did not completely disrupt hyper-scaler spending or spending plans, it likely slowed future growth. (See the introduction here for our initial views on the DeepSeek announcement).
In early January (here), we wrote about our concern of a slowdown in hyper-scaler spending:
What if a the hyper-scalers that are spending $250 billion on AI capex announce or are forced by the market to announce that they are slowing spending?
With one hiccup in the spending cycle, we could see a re-rating of the whole data center eco-system from chips, to modular nuclear power infrastructure, to cooling systems to data center REITs.
As a reminder, the AI trend and the adjacent beneficiaries represented a disproportionate portion of US equity returns in 2024.
In our view, the DeepSeek announcement led to the slowdown in hyper-scaler spending that we feared.
The Zelensky White House meeting.
The Zelensky White House meeting took place on February 28th. It is hard to remember that the S&P 500 at that time was at 5900, about 3.5% below its all-time high.
After the Zelensky White House meeting, Germany announced a $500 billion fiscal stimulus (it’s been estimated to be larger) to facilitate investment in infrastructure and defense.
We believe that Zelensky White House meeting could have been the initial catalyst (or at least the starting gun) to reversing US equity outperformance over European equities (see Chart 5) and potentially global equities.
“Liberation Day.”
One of our concerns entering 2025 was the transition from Treasury Secretary Yellen to Treasury Secretary Bessent and the differing policy priorities of Trump 2.0 from those of the Biden administration. (See the introductions here, here and here).
There is no way to defend (nor would we want to) the roll-out or any other aspect of the “Liberation Day” (including its name) tariffs. (See our initial reaction here and chart 1 here).
We view “Liberation Day” as adding to economic growth concerns, leading to another leg lower in the dollar (see chart 4 below) and driving negative earnings revisions (see chart 2 below).
Furthermore, the uncertainty around tariffs and trade policy will likely be a catalyst for valuation multiple contraction.
None of these three events were specifically predictable, however, we have been expecting this type of US equity market volatility since last early last June. (See an evolution of our thinking here and a more recent reflection here).
Amazingly, the S&P 500 is above where it was a year ago.
While these events have been somewhat priced into the market at current levels we do not view them as 100% incorporated.
That said, before becoming overly negative, we want to consider what could go “right”:
The Dollar. A weaker dollar is good for US corporate earnings and competitiveness abroad. Dollar weakness has been correlated with US equity strength over the past five years (until the most recent period). (See chart 4, below).
Oil. Lower oil prices support consumer spending (more money for other things) and is an off-set to other inflationary pressures.
Trade Policy. If (and it’s a big if), the Trump administration can establish a more thoughtful trade policy that includes agreements with Europe and Japan and a lower tariff rate with China, this would obviously be a relief.
Fed policy. While I support a strong independent central bank, it would likely be more justifiable for the Fed to ease in the current environment than it was for them to cut last September when the S&P 500 was at an all-time high (trading at 22x earnings); inflation was higher than it is today; and US gdp expectations were stronger.
Tax policy / Fiscal Stimulus. President Trump has continually spoken about the need to extend his 2017 Tax Cuts and Jobs Act and to add further corporate and income tax breaks to it. While this is a challenge given the fiscal deficit and debt outstanding, if it happens, it may be a positive for equity markets.
Sentiment. While sentiment is difficult to determine, there are a number of measures we watch, from surveys to market based indicators, which are reflecting extreme negativity. “Buy when other are fearful.”
How do we incorporate the mixed narrative above into our overall views?
As we have highlighted, if investors can project $300 in 2026 S&P 500 earnings (this may be dependent on some of the above mentioned “what can go right” factors), we could potentially justify an 18-19x multiple leading to a year-end level on the S&P 500 of 5400-5700 (+3-8% from current levels).
On the downside, we still believe there is the likelihood of a re-test of the recent lows (~4800 on the S&P 500) and the possibility of a new low (~4500 - 15x 2026 earnings?) if our wish list of policy-based “what can go right” factors does not develop (-8-15%).
We continue to be positioned conservatively with more cash (20-30%) than typical given our risk / reward framework.
However, we are adding to individual equity positions where we see longer-term value and we are increasing our exposure to Europe and non-US equities.
We are hopeful that the environment of negativity will, at some level, be an opportunity.
“Doctor! Doctor! Can’t you see I’m burning burning?”

1. The S&P 500 ETF: Higher than Last April, but Fragile

Source: TradingView. Through year-to-date 2025.
The chart above shows the S&P 500 ETF (ticker: SPY).
Although the S&P 500 ETF has somewhat stabilized above its August 2024 low and is above its April 2024 low we still consider it to be fragile. (The arrow on the chart is our indication that the S&P 500 is above its year-ago low).
While the chart reflects our “technical” view, our concern is largely based on earnings and valuation (fundamentals).
As can be seen on chart 2, next 12 months earnings (Q2 2025 through Q1 2026) are now $276.
Even a 20x multiple on expected earnings only brings the S&P 500 5520 and we don’t believe a 20x multiple is warranted given the current environment.
We continue to see the near-term (3-6 months) upside as constrained in the index, while downside risks remain.
Although our view remains that there is a 60-70% chance of a retest of the recent low, it could evolve over-time (two to three months).
As can be seen, the recent low nearly coincided with the January 2022 high of 480.
What is not shown (we will show another time) is that the 200-week moving average, that has largely acted as a floor over the past 15 years is now at 467 and climbing (slowly).
These are our two initial downside targets.
If those targets are hit while some of the items on our “what could go right list” have developed, we will be aggressive buyers.
However, a combination of continued uncertainty and a meaningful break below would likely give way to significant further downside.
(This is not a recommendation to buy or sell any security and is not investment advice. Past performance is not indicative of future results. Please do your own research and due diligence).
2. Earnings Expectations through Q1
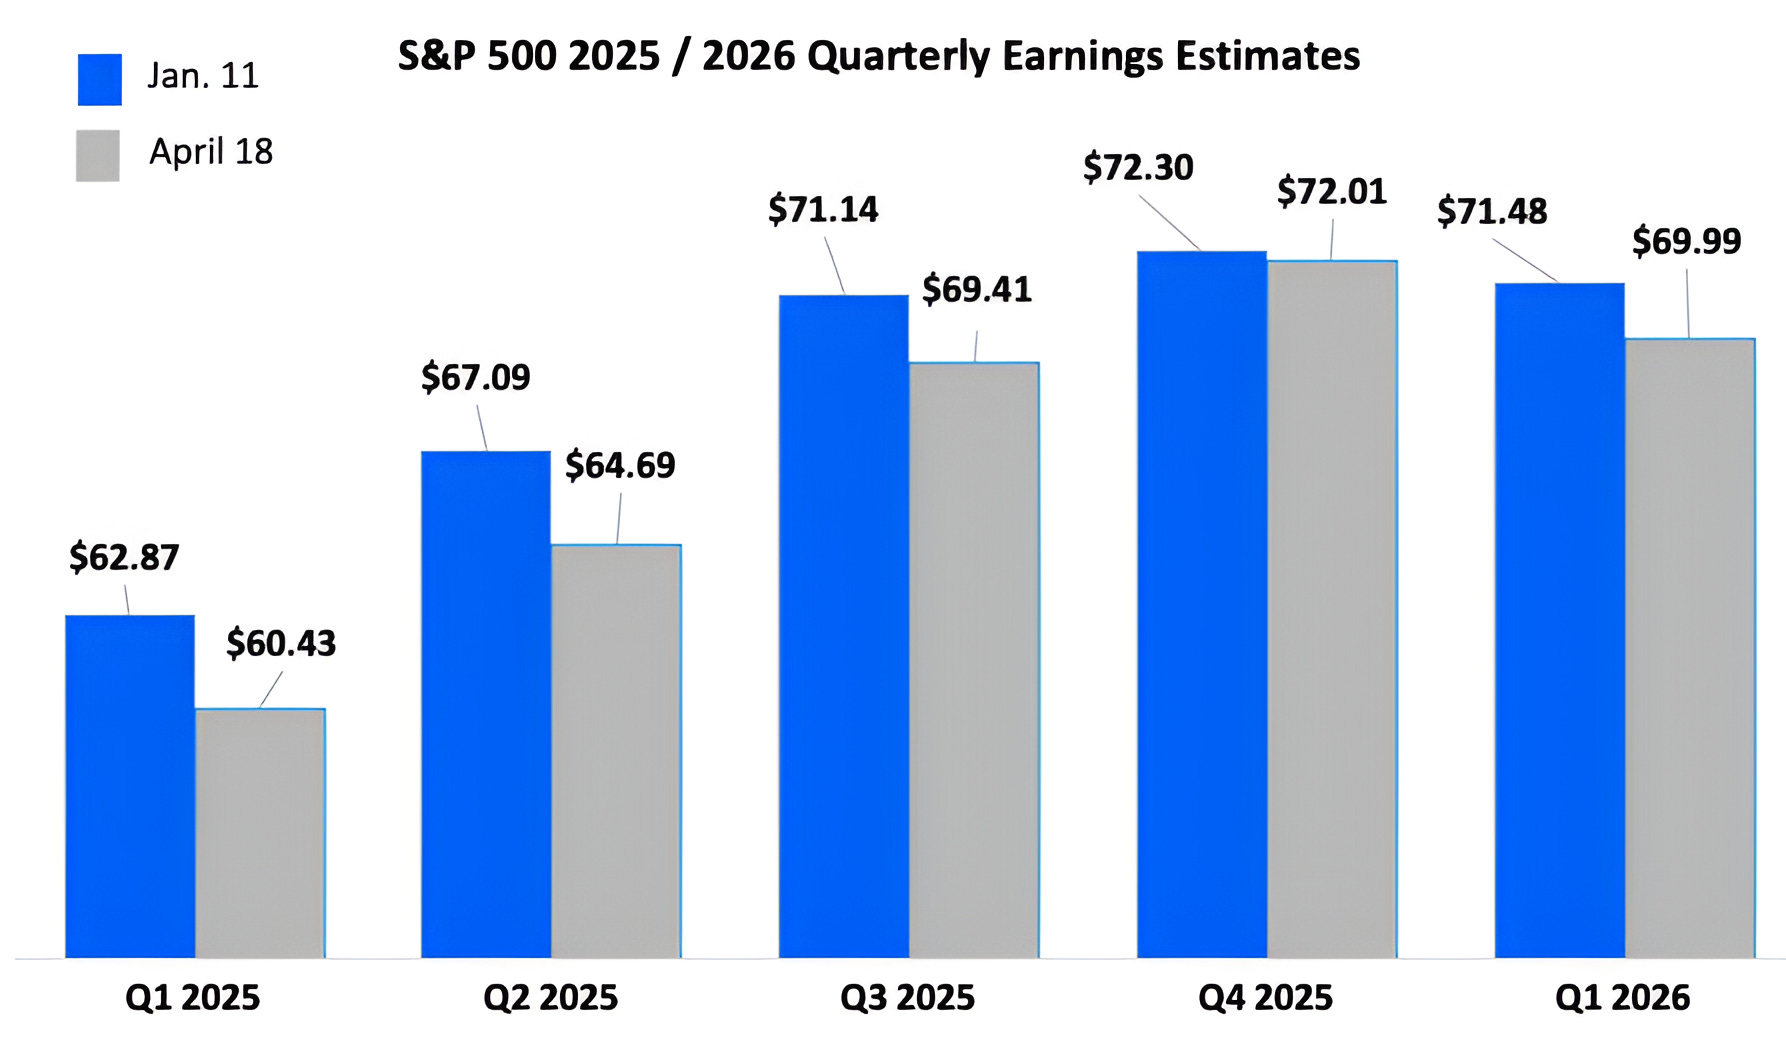
Source: FactSet and Luminos Advisors. Through year-to-date 2025.
The chart above shows S&P 500 bottoms-up quarterly earnings expectations for Q1 2025 through Q1 2026.
We have recently seen some articles and analyses suggesting that next 12 months earnings have increased.
This, in our view, is simply due to the calendar moving forward.
In other words, prior to the start of earnings season two weeks ago, the next 12 months earnings calculation was based on Q1 2025 through Q4 2025 which is currently $266.54.
Simply by moving the calendar forward, we are now consider the next 12 months earnings calculation based on Q2 2025 through Q1 2026 which is currently $276.10.
To eliminate this noise, we have been focused on 2026 expected earnings which are currently $304 down from $308 on January 11.
We continue to show the changes to 2025 quarterly earnings expectations because:
a) it informs us about the actual operating environment as we believe companies have more insight into Q2 2025 earnings than they do into 2026 earnings; and
b) 2025 earnings will set a baseline from which 2026 earnings will grow. In other words, if we believe 2026 S&P 500 earnings will grow 10%, if 2025 earnings are $260, 10% growth would be a different outcome than if 2025 earnings were $280.
We find it notable that Q1 earnings have been reduced by 3.9% since early January and Q2 earnings expectations are 3.5% lower while earnings for the second half of the year have only been trimmed by 1.4%.
We would expect the tariff and business uncertainty to hit second half earnings more than Q1 earnings.
Furthermore, 2026 earnings have only come down 1%.
While we still see a path to $300 in 2026 S&P 500 earnings through a combination of tax cuts, tariff negotiations and monetary easing, in our view, there is a risk that 2026 earnings come in closer to $280 (a 10% reduction from January 2025 expectations).
Even if we assume $300 for 2026 S&P 500 earnings, we need to consider what multiple those deserve.
In the current environment, we believe 18-19x is the maximum (5400-5700).
In past periods of volatility, the S&P 500 has bottomed at 15x forward earnings (see chart 3 here).
If that is the case in the current period, based on $300 in earnings, we could see a low of 4500 and based on next 12 months earnings of $280, a low could be 4200.
(Past performance is not indicative of future results. This is not a recommendation to buy or sell any security and is not investment advice. Please do your own due diligence).
3. The Nasdaq 100, a Hard Habit to Break
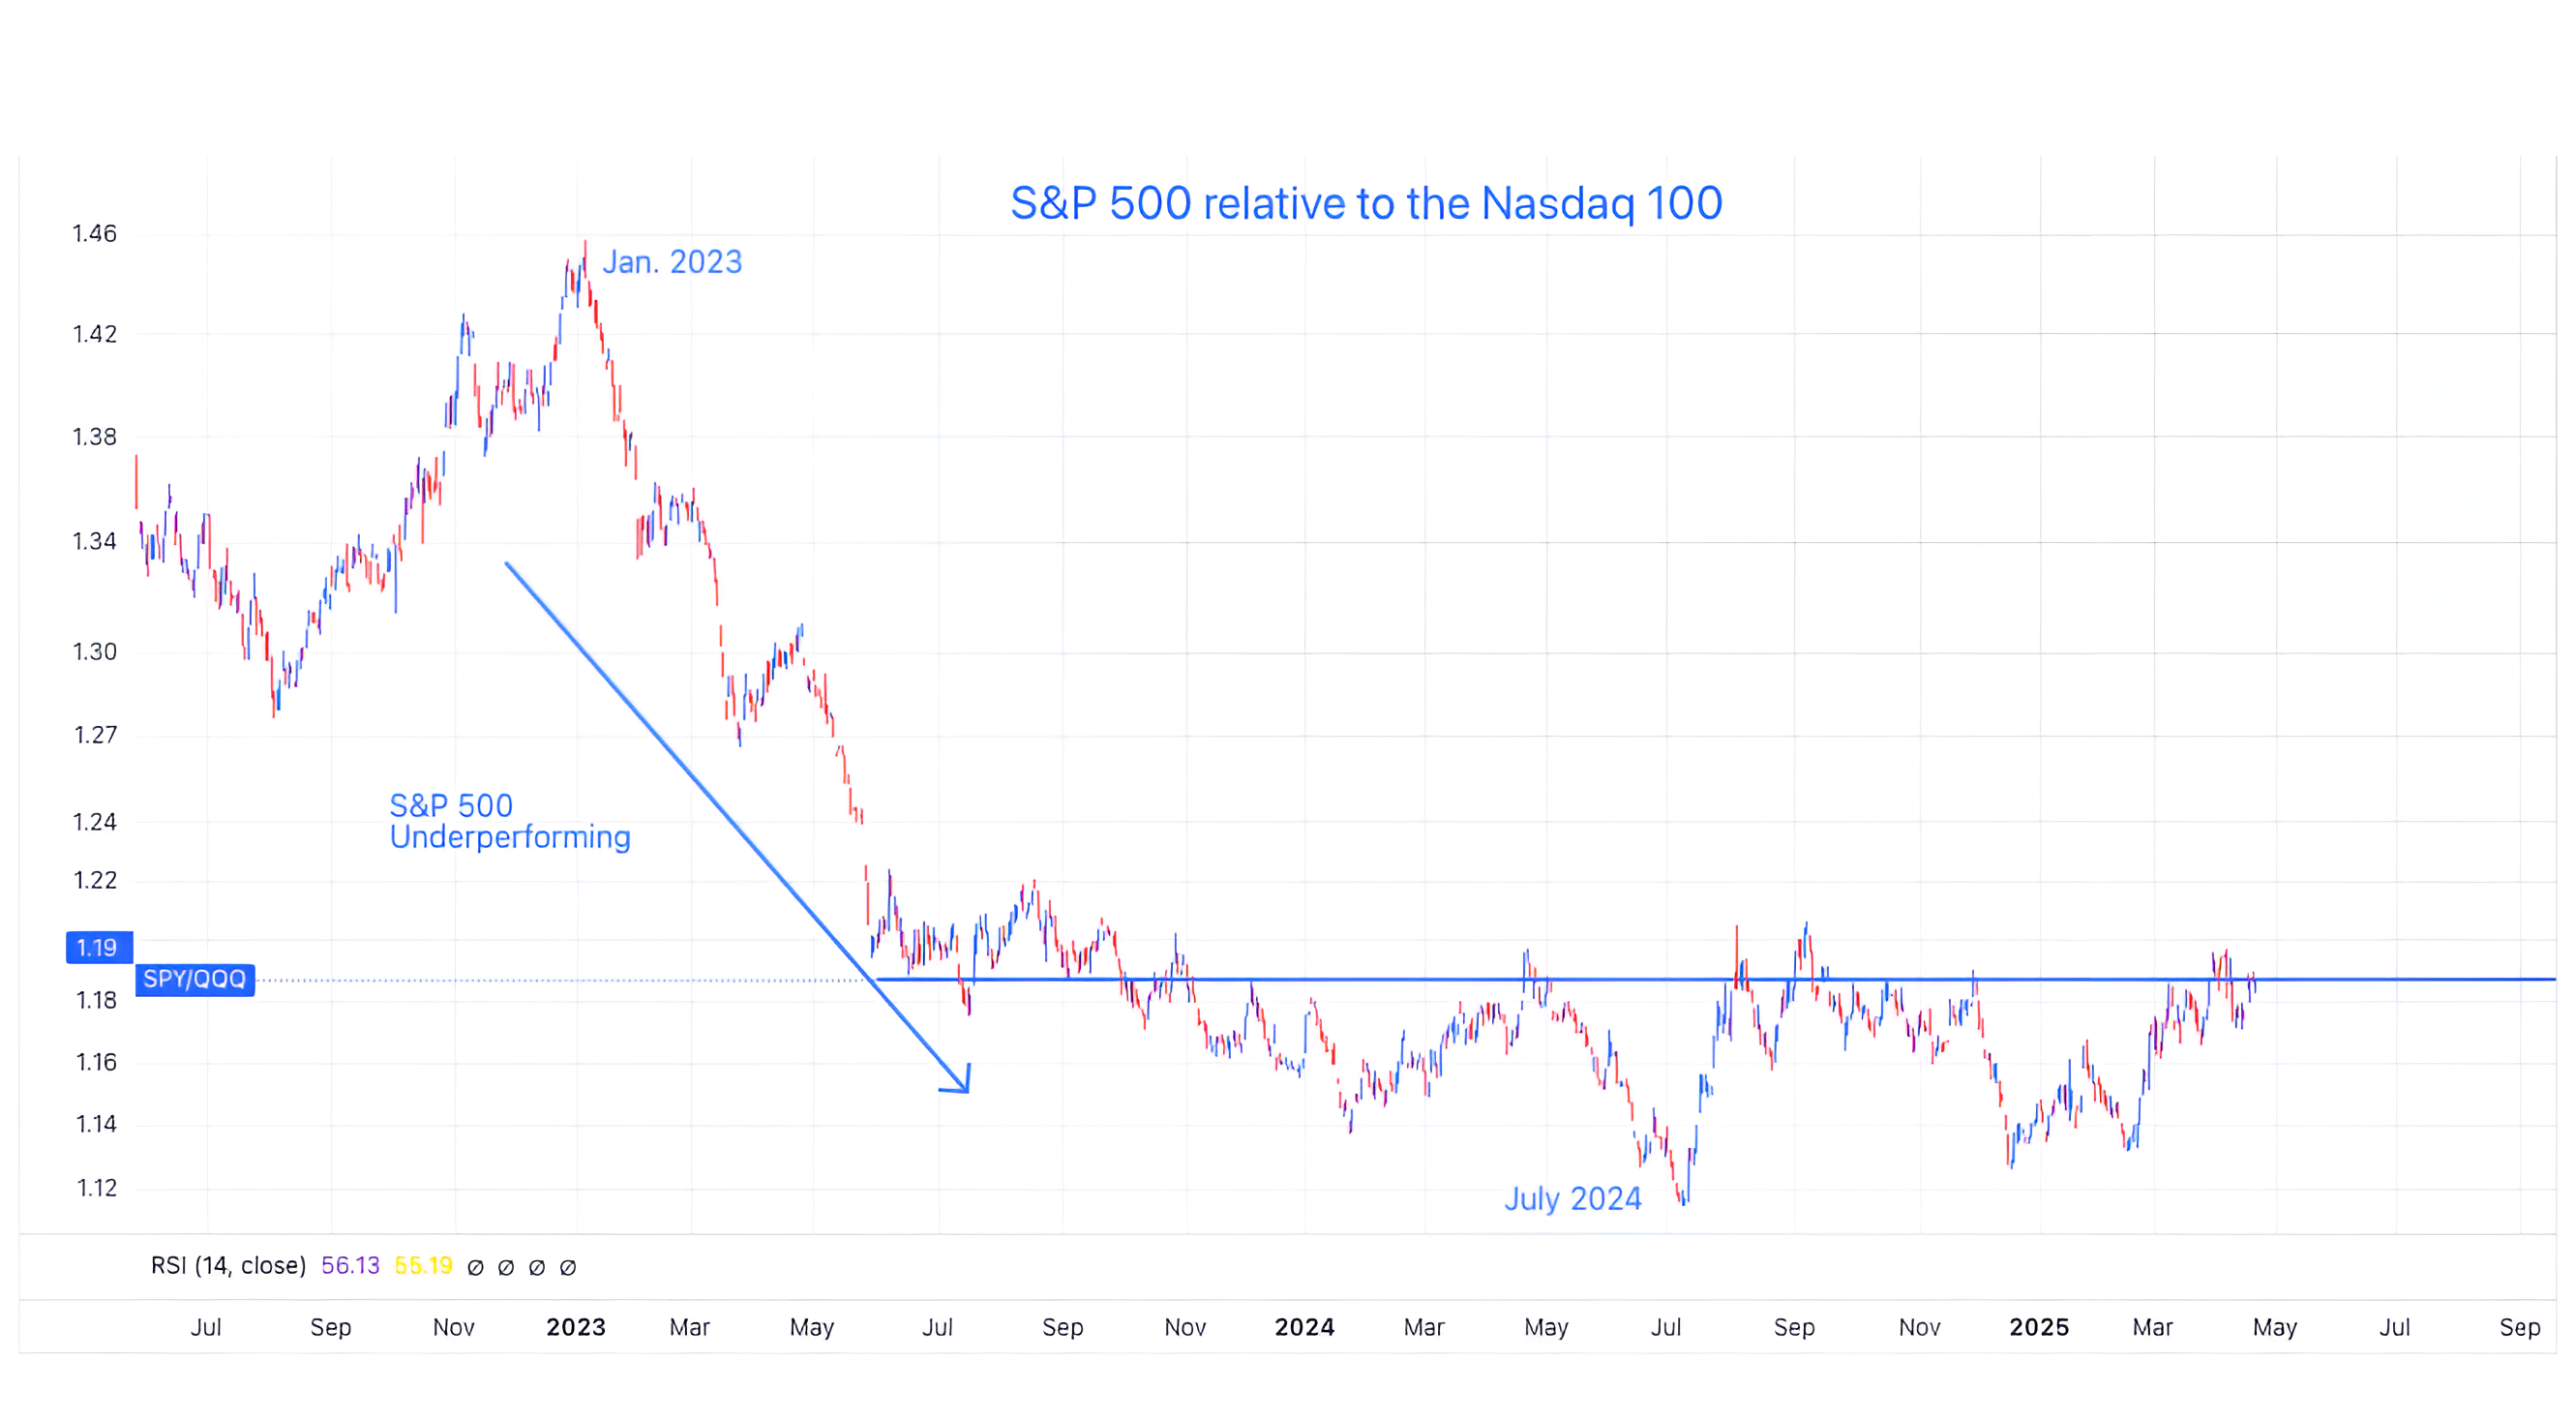
Source: TradingView. Through year-to-date 2025.
The chart above shows the S&P 500 ETF (ticker: SPY) relative to the Nasdaq 100 ETF (ticker: QQQ).
When we look at relative charts, we view these as answering the question: “where do we want to be invested?”
In other words, if the Nasdaq 100 is moving higher 30% and the S&P 500 is moving higher by 20% - it is ok to be invested in the S&P 500. However, all else equal, I would prefer a 30% return to a 20% return.
This is what is captured in the S&P 500 underperformance from January 2023 to July 2024 on the chart above.
Similar to individual stocks and indexes, relative charts “trend.” Outperformers often continue to outperform.
It is within this context that we are viewing the chart above (and chart 5 below).
We believe that if the relationship between the S&P 500 and the Nasdaq 100 moves meaningfully above the horizontal line that we have drawn in, we want to de-emphasize the Magnificent 7, Technology and the Nasdaq 100 in our portfolios and to focus on more value-oriented (Financials, Energy) and potentially defensive sectors (Utilities, Staples, Healthcare).
(Past performance is not indicative of future results. This is not a recommendation to buy or sell any security and is not investment advice. Please do your own research and due diligence).
4. Putting US Dollar Weakness in Context
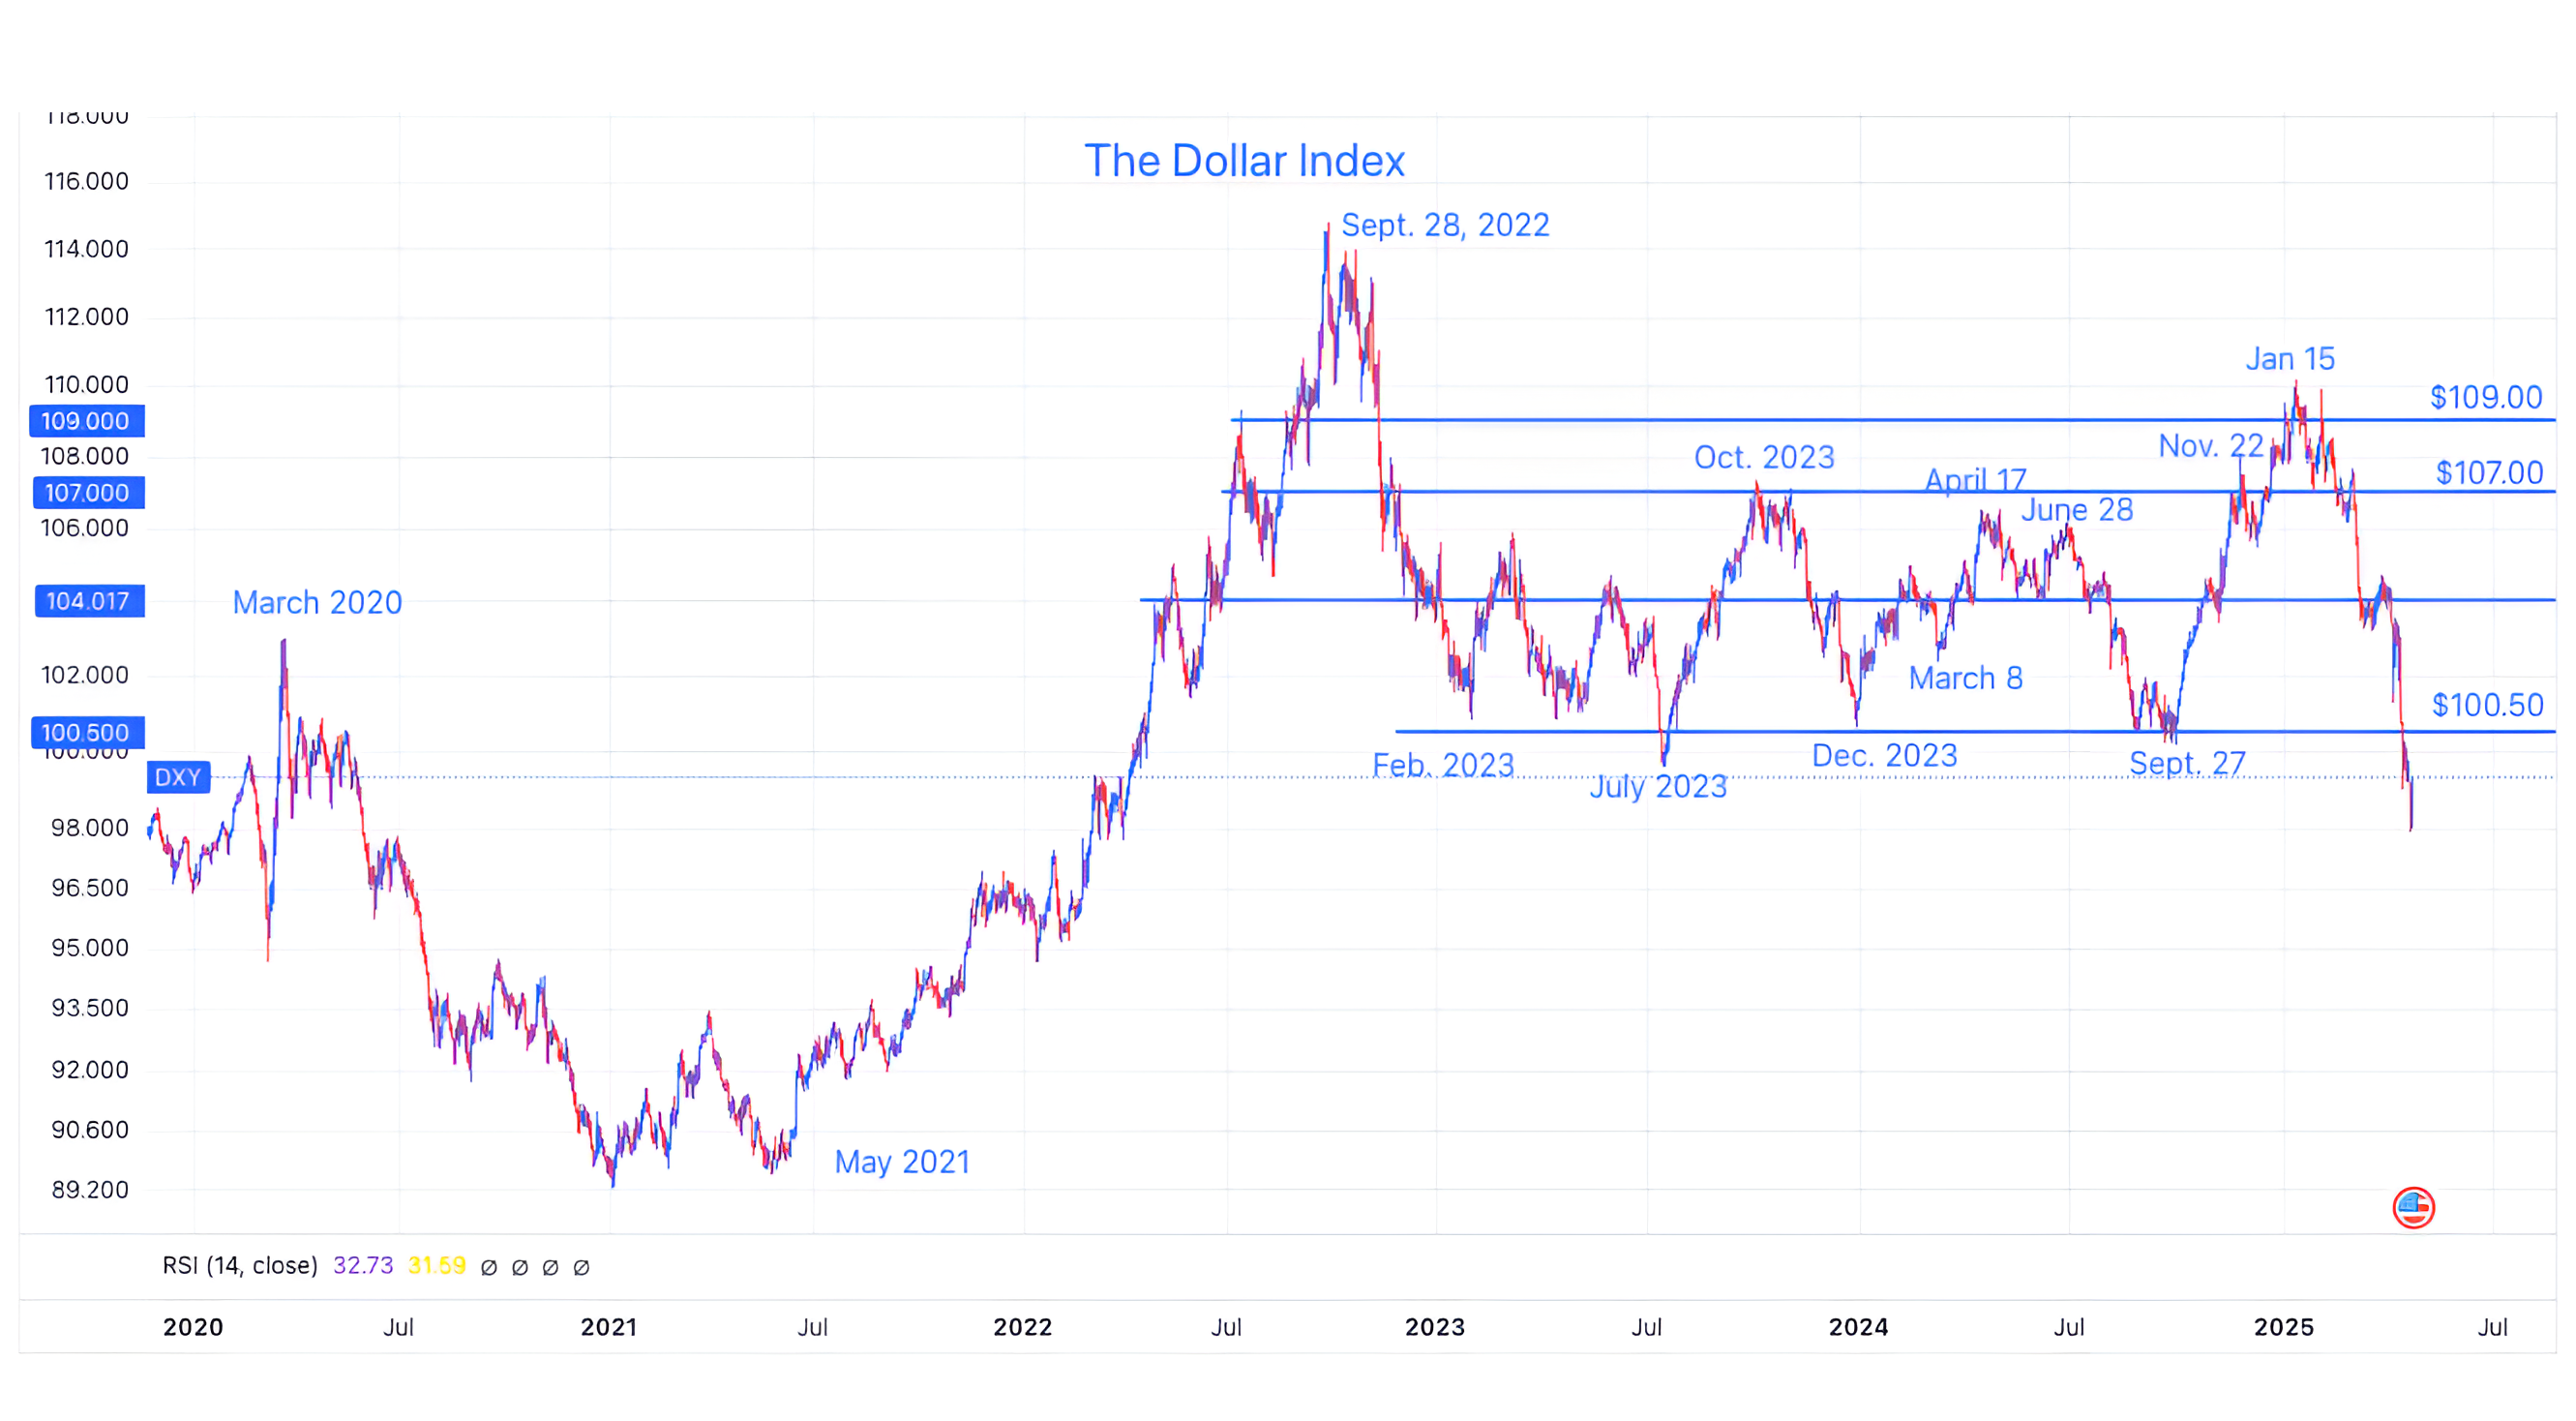
Source: TradingView. Through year-to-date 2025.
The chart above shows the Dollar Index (DXY).
Typically, the US dollar strengthens and 10-Year Treasury Yields decline on a “flight to safety” trade.
As a result there is alarm around the concept that in a period of volatility that the US dollar is weakening and Treasury Yields are moving higher.
It is important to put the level of the US dollar into context.
The US dollar is now basically at the level it was when it traded at maximum fear in March 2020 a the peak of the pandemic sell-off.
While the 9% sell-off in the US dollar since January has been a dramatic move, it is smaller than the 11% decline from October 2022 to February 2023 and the 13% post-covid drop.
Importantly, both of these prior sell-offs were supportive of and coincided with equity market rallies.
(Past performance is not indicative of further results. This is not a recommendation to buy or sell any security and is not investment advice. Please do your own due diligence).
5. European Equities: Beginning to Add
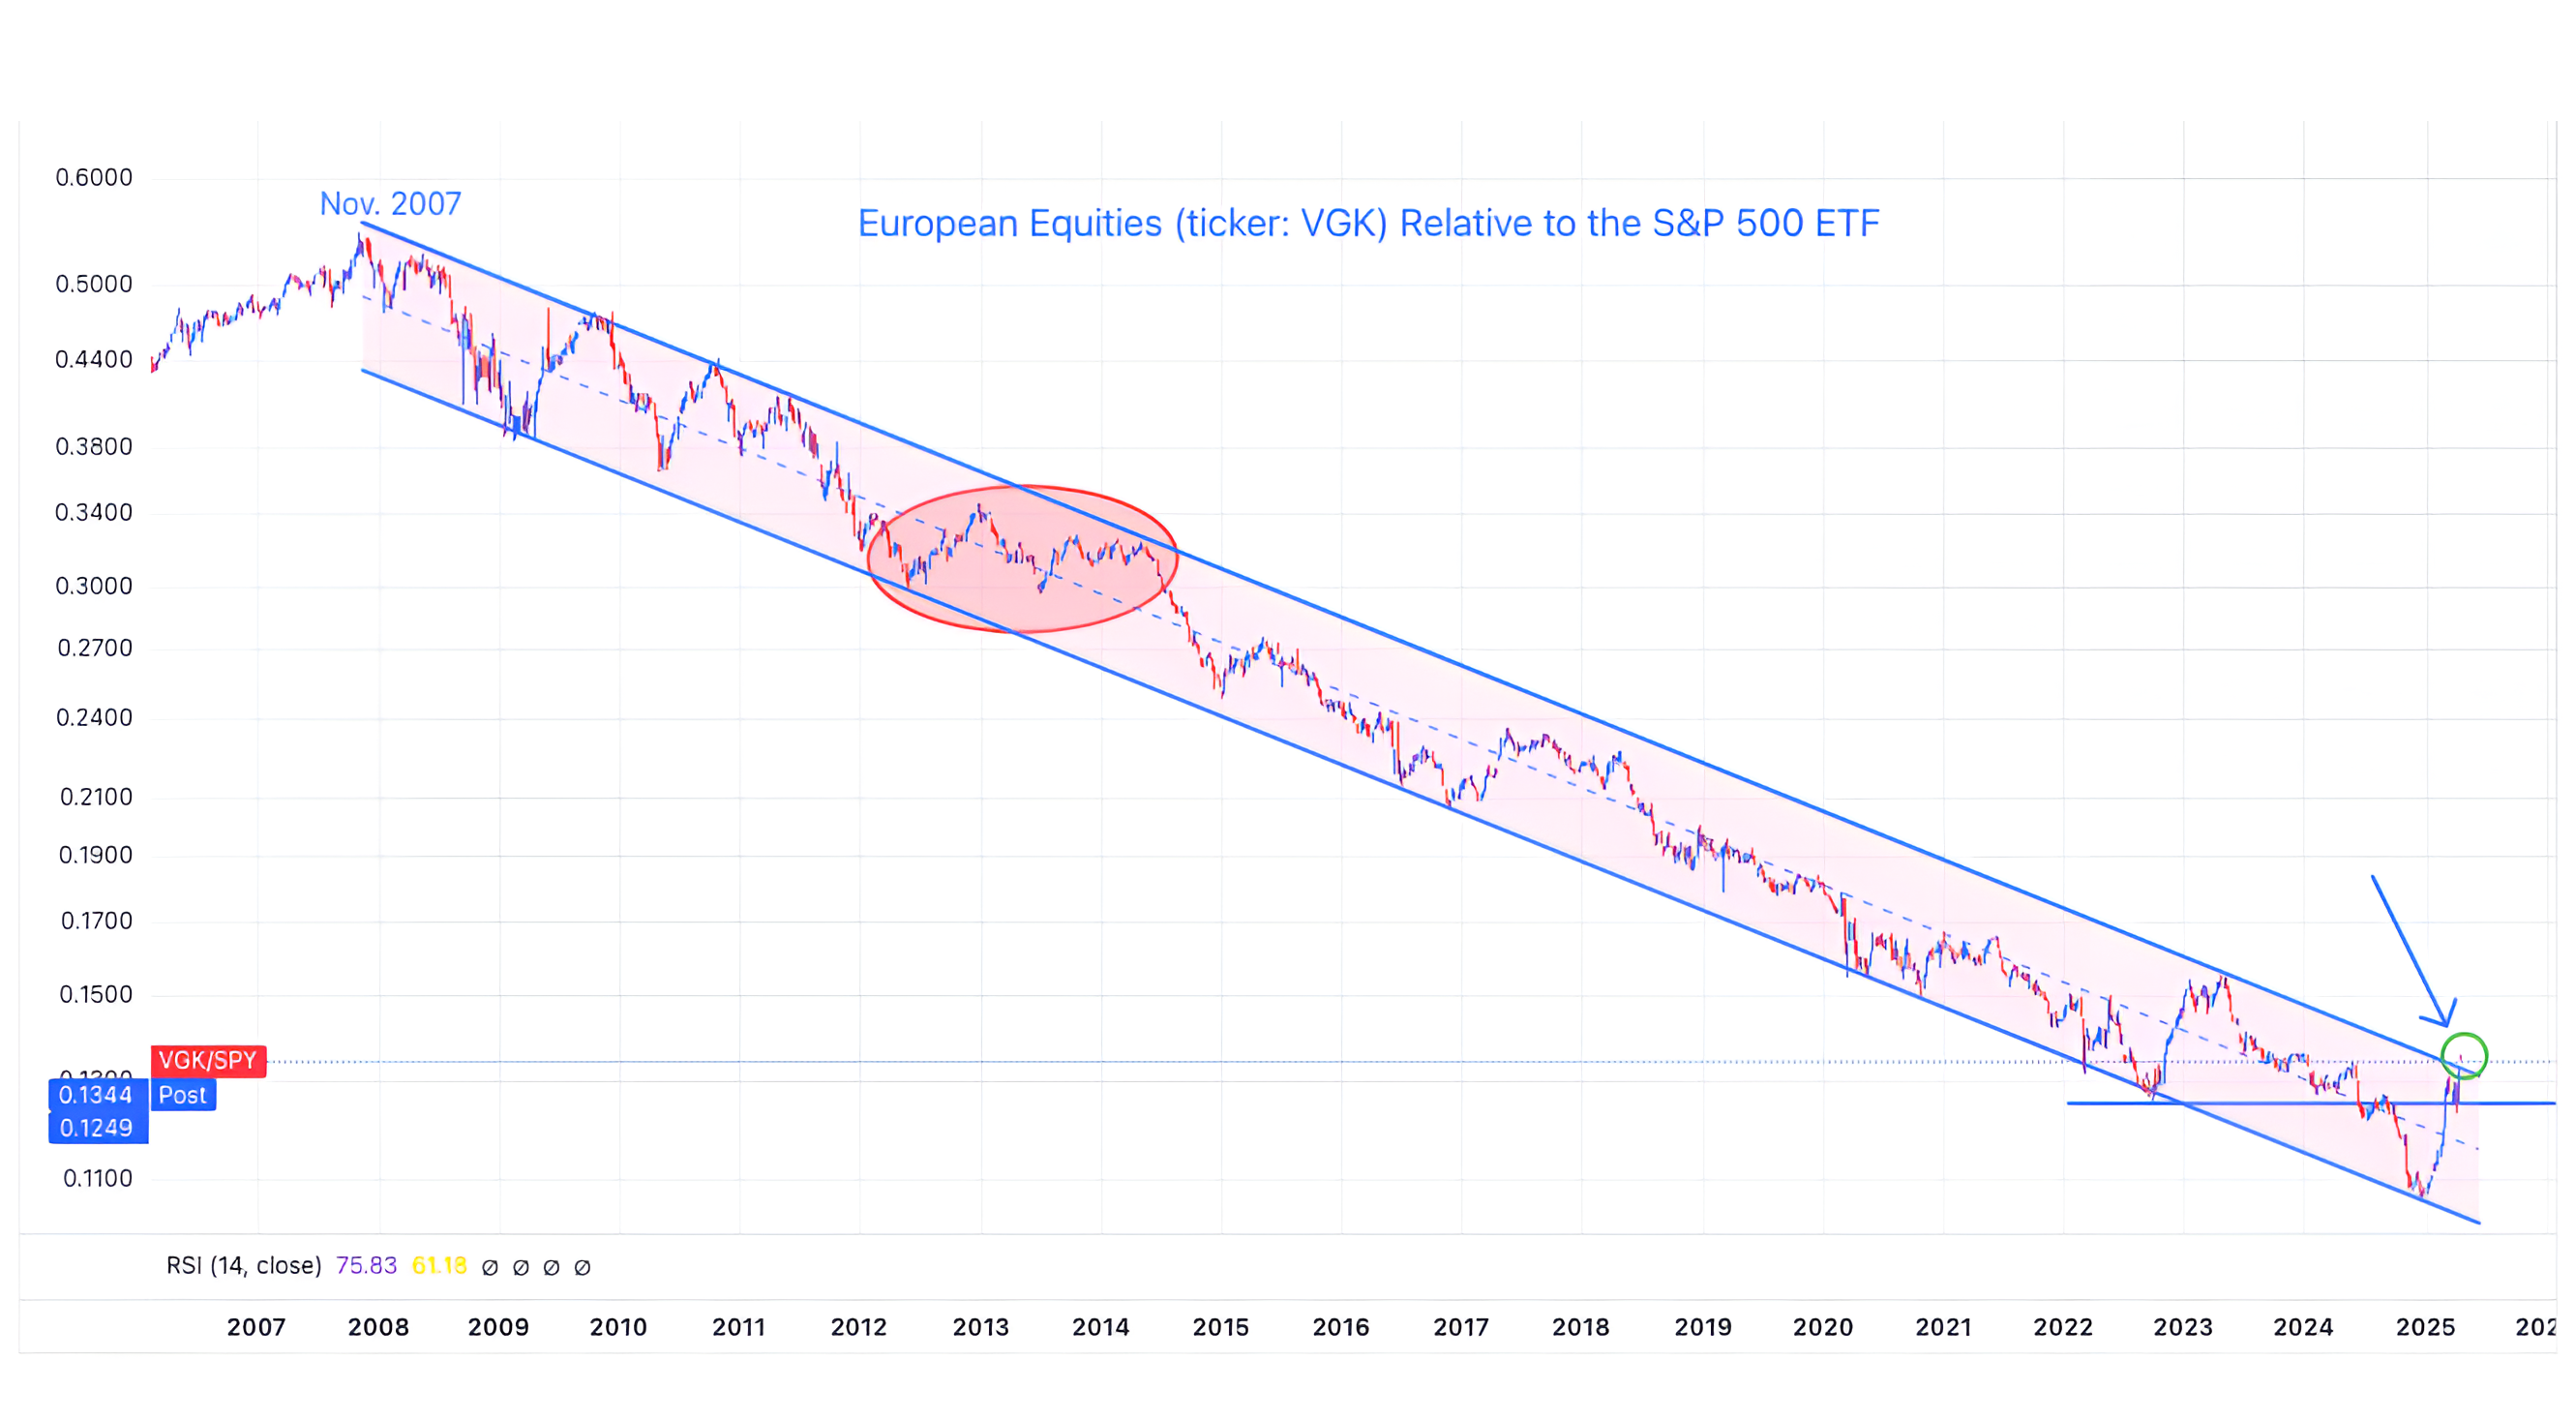
Source: TradingView. Through year-to-date 2025. Through year-to-date 2025.
The chart above shows the Vanguard Europe ETF (ticker: VGK) relative to the S&P 500 ETF (ticker: SPY).
As we wrote in chart 3 above, When we look at relative charts, we view these as answering the question: “where do we want to be invested?”
For the last 18 years, it has made sense to be invested in US equities over European equities.
We believe that could be changing
In the aftermath of the Financial Crisis, the European Union never provided the fiscal stimulus or recapitalized its banks like the US did.
In our view, this lack of aggressive policy has been partially responsible for European equity underperformance.
(This is why we referenced the Zelensky meeting / German stimulus in the introduction).
We looked at the European Equity ETF last Thursday presented some highlights:
Valuations in Europe in general are more attractive than those in the US and continue to trade a more significant discount to US equities than typical. (Absolutely and relatively cheap vs. history). That said - these valuations measures have not been catalysts for outperformance in the past.
We believe - and we’ve highlighted this in the past - that large European portfolio managers that have ended up overweight US equities - partially by design and partially due to US equity outperformance - are now bringing capital back to Europe. We provided a description of this dynamic in chart 3 here.
Given the tariff uncertainty, European companies will likely be beneficiaries.
The ECB cut rates today (Central Banks drive markets) and Germany is providing fiscal stimulus to support its NATO commitment.
With the move above the long-term relative downtrend channel (green circle and arrow on chart above), we are beginning to add to our European equity exposure.
(Past performance is not indicative of future results. This is not a recommendation to buy or sell any security and is not investment advice. Please do your own research and due diligence).